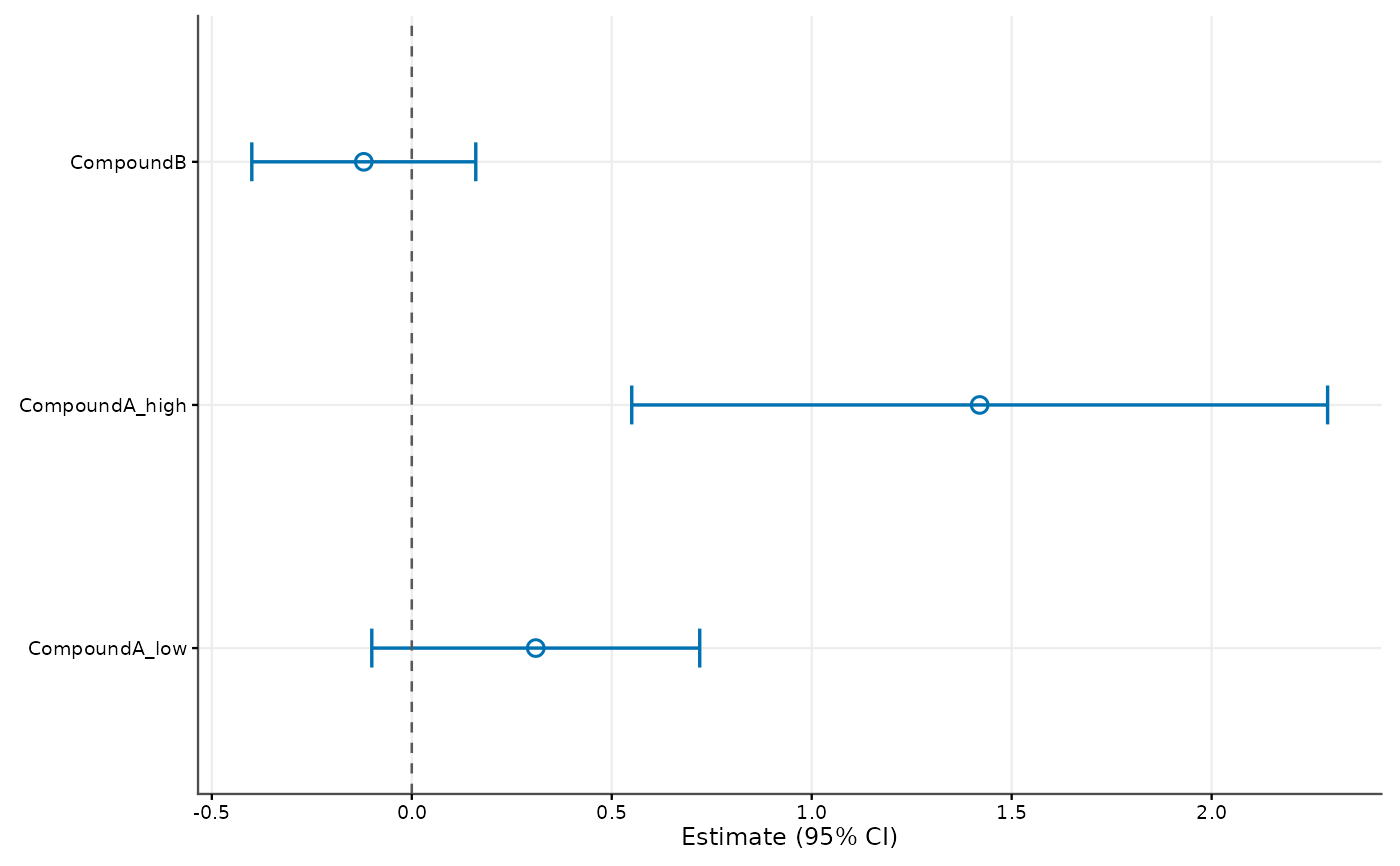
Plot estimates and confidence intervals
Usage
cr_plot_estimates(
  data,
  estimate = "estimate",
  lower = "conf_low",
  upper = "conf_high",
  label = "group",
  group = NULL,
  reference = 0,
  order_by = c("design", "estimate", "name"),
  colour_mode = c("colour", "grayscale"),
  style = NULL
)
Arguments
- data
Data frame of finalized estimates.
- estimate, lower, upper, label
Column names.
- group
Optional grouping column, redundantly encoded by colour and shape.
- reference
Optional explicit reference value.
- order_by
design, estimate, or name.
- colour_mode
Colour mode.
- style
Optional cr_plot_style.
Examples
estimates <- data.frame(
  group = c("CompoundA_low", "CompoundA_high", "CompoundB"),
  estimate = c(0.31, 1.42, -0.12),
  conf_low = c(-0.10, 0.55, -0.40),
  conf_high = c(0.72, 2.29, 0.16)
)
cr_plot_estimates(estimates)