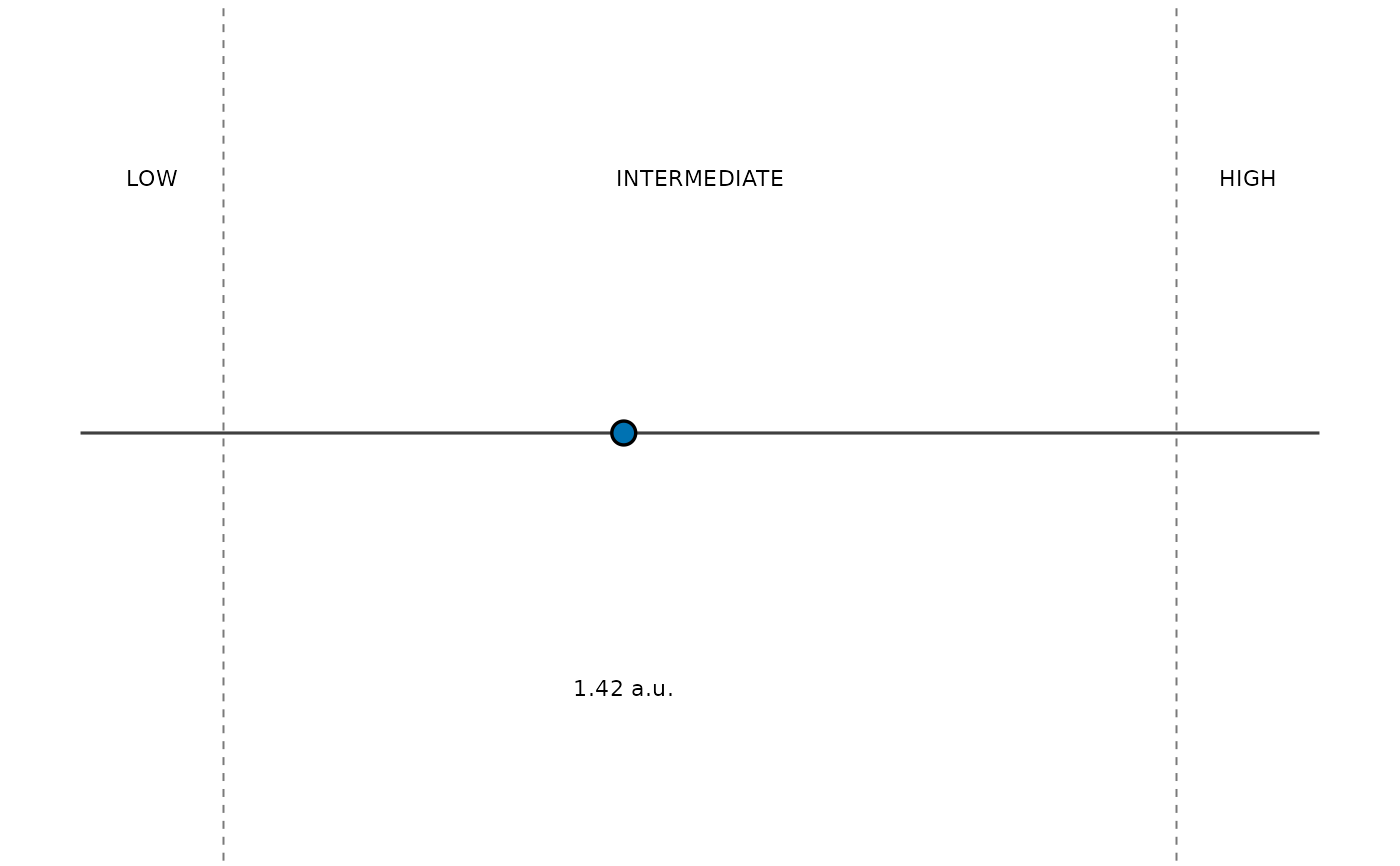
Plot a value relative to caller-supplied boundaries
Source:R/report-lab.R
cr_plot_result_position.RdPlot a value relative to caller-supplied boundaries
Usage
cr_plot_result_position(
  value,
  thresholds,
  labels = NULL,
  xlim = NULL,
  unit = NULL,
  classification = NULL,
  show_value = TRUE,
  mode = c("colour", "grayscale"),
  style = NULL
)
Arguments
- value
Single finite numeric value.
- thresholds
One or more sorted finite boundaries.
- labels
Optional labels for the resulting intervals; must have one more item than thresholds.
- xlim
Optional two-value display range.
- unit, classification
Optional user-supplied marker labels.
- show_value
Include the numeric value below the marker.
- mode
Colour or grayscale rendering.
- style
Optional
cr_plot_style().