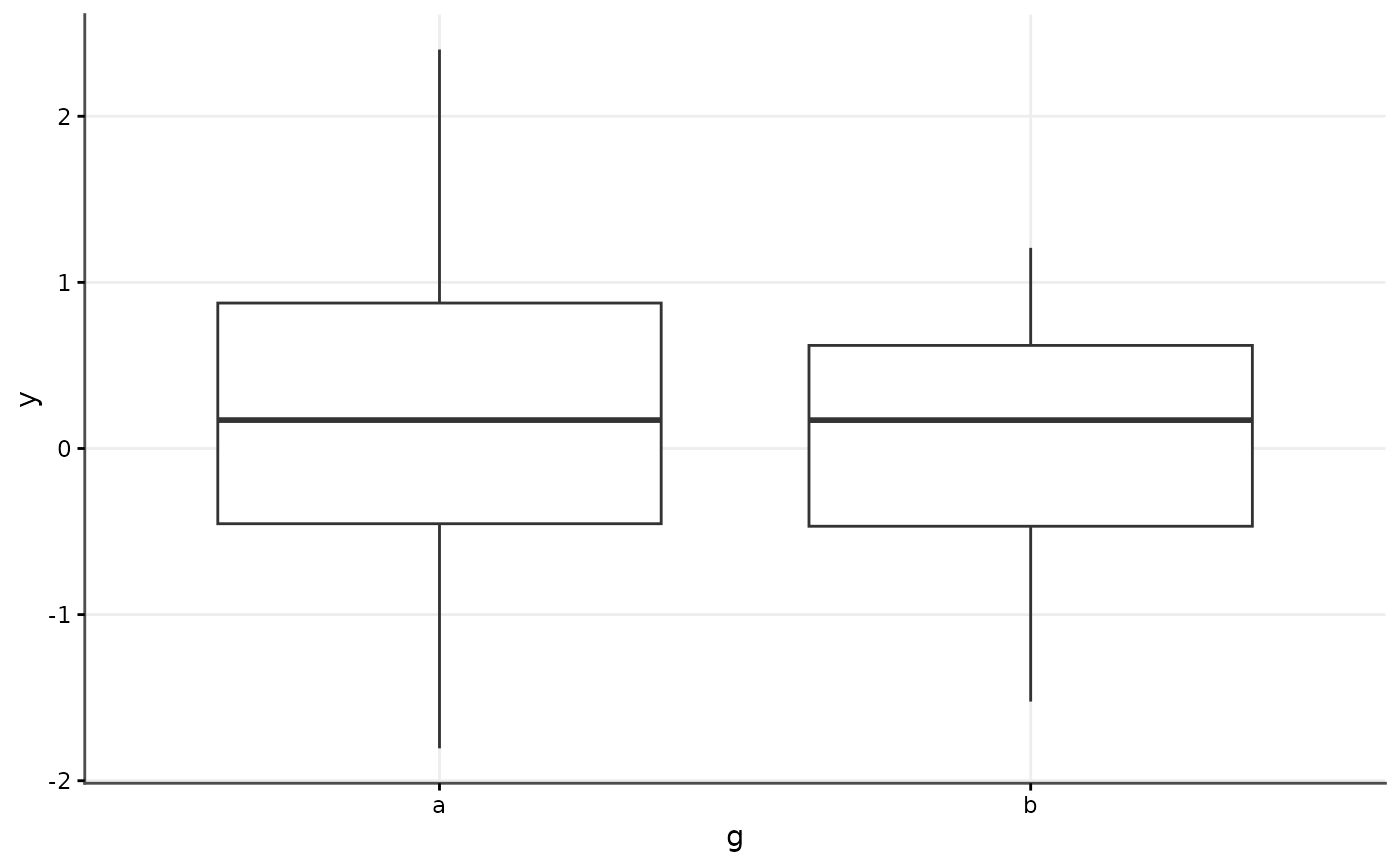
The single ggplot2 theme every cr_plot_* function applies, so that
figures assembled from different functions sit together without
re-styling: a classic axis-line frame, a faint major grid, a bold title, a
muted subtitle and a bottom legend.
Arguments
- base_size
Base font size in points (default
11).- base_family
Base font family. Default
""(the device default), which keeps figures reproducible across machines.- grid
Draw the faint major grid (default
TRUE).- legend_position
Passed to
ggplot2::theme(). Default"bottom".
See also
cr_palette(), cr_scale_group()
Other plot design:
cr_palette(),
cr_scale_group(),
cr_shapes()
Examples
df <- data.frame(g = rep(c("a", "b"), each = 20), y = rnorm(40))
ggplot2::ggplot(df, ggplot2::aes(g, y)) +
  ggplot2::geom_boxplot() +
  cr_theme()