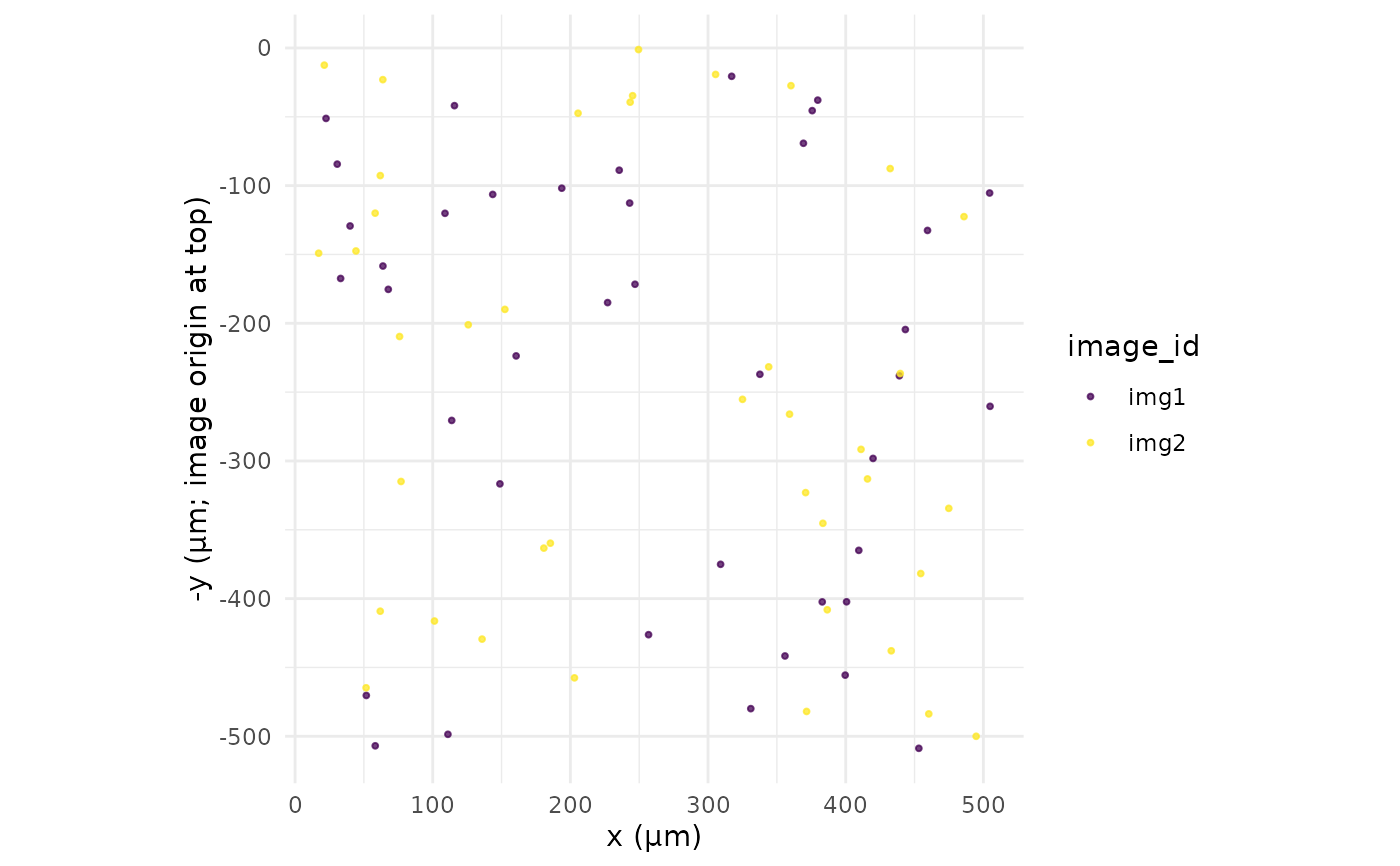
Draws a centroid map, marker distribution, feature-support heatmap, cell
area distribution, or an overview of up to four panels. The overview leaves
out the area panel when the cells table has no area column and the marker
panel when there are no intensity features. Large objects are subsampled
deterministically for plotting.
Arguments
- x
A
cellspecobject.- type
Plot type:
"overview","map","marker","support"or"area".- colour_by
A cells or measurement column used by the map.
- marker
Marker used by the marker plot.
- policy
Optional signal policy for the marker plot.
- max_points
Maximum number of cells used by a plot.
- seed
Seed used for deterministic subsampling.
- ...
Reserved for future plot-specific parameters.
See also
Other methods:
[.cellspec(),
as.data.frame.cellspec(),
cellspec-methods
Examples
if (requireNamespace("ggplot2", quietly = TRUE)) {
  plot(cs_example(), type = "map")
}