    Welch Two Sample t-test

data:  sbp_1 - sbp_0 by arm
t = -4.1946, df = 117.89, p-value = 5.319e-05
alternative hypothesis: true difference in means between group drug and group placebo is not equal to 0
95 percent confidence interval:
 -8.062838 -2.891366
sample estimates:
   mean in group drug mean in group placebo
-6.593619 -1.116518 Week 1, Session 1 — Scientific process and research workflow
Course 1 — #courses
R. Heller
Note
Workflow labs use the variant template: Goal → Approach → Execution → Check → Report.
Learning objectives
- Name the nine stages of the research workflow and say what goes wrong if each is skipped.
- Distinguish biological from statistical significance with an example.
- Frame a research question that can survive a methods section.
Prerequisites
R, RStudio, and Quarto installed (see Get started).
Background
Statistics is a thread running through a longer process that begins before a dataset exists. The research workflow — Question → Measurements → Design → Acquisition → Description → Analysis → Interpretation → Validation → Knowledge — names the stages of that process and makes clear that errors made at one stage are paid for at the next. A well-posed question protects you from a bad design; a good design protects you from a noisy dataset; a clean dataset protects you from needing exotic methods. Much of what looks like statistical failure in the literature is in fact a workflow failure three stages earlier.
The workflow also organises how you write up the work. The Introduction names the question; the Methods describe the measurements, design, and analysis; the Results describe the data and the inference; the Discussion interprets. When you plan an analysis in this order, the paper nearly writes itself. When you skip a stage, reviewers notice exactly which one.
Setup
1. Goal
Make the research workflow concrete by simulating a small clinical scenario and mapping each stage to a specific decision.
2. Approach
Imagine a new blood-pressure drug. Our simulated question: does drug X reduce systolic blood pressure compared with placebo in adults with hypertension? We will generate data that reflect a realistic effect and walk through the workflow.
3. Execution
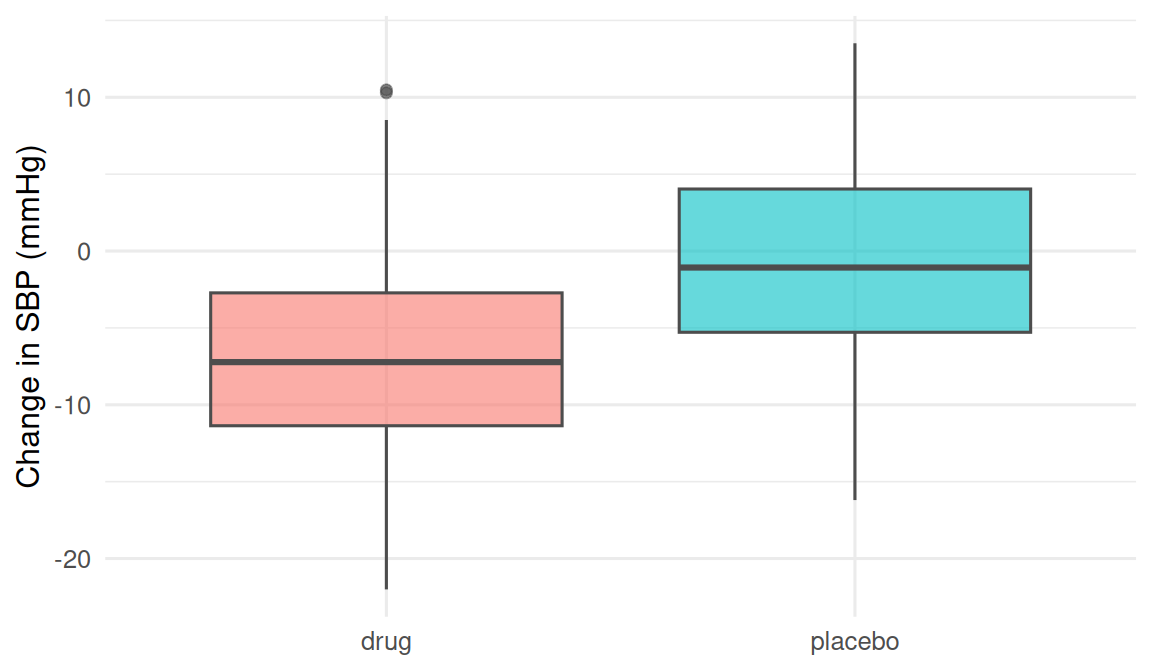
The plot is the Description stage. Without it, we would skip straight from raw numbers to a test. With it, the direction and spread of the change are visible before a single calculation.
4. Check
The drug arm has a lower change-in-SBP on average; the interval is compatible with a clinically meaningful effect.
5. Report
In a simulated two-arm trial (n = 120), mean change in systolic blood pressure differed by -5.5 mmHg (drug − placebo) (95% CI: -8.1 to -2.9; p = 5.3^{-5}).
Note the three pieces every report needs: direction and magnitude, an interval, and a p-value reported alongside — never instead of — the effect.
Biological vs statistical significance
A p-value below 0.05 does not, on its own, mean the effect matters clinically. A reduction of 0.1 mmHg in SBP would be statistically significant with a million patients but biologically meaningless. The discipline of asking how large is the effect? — not is there any effect? — is the single most important habit to form in Course 1.
Common pitfalls
- Skipping the description stage and running a test on data you have never plotted.
- Reporting a p-value without an effect size and interval.
- Conflating biological and statistical significance.
- Treating the research workflow as optional once data are in hand.
Further reading
- Research workflow appendix.
- Altman DG. Practical Statistics for Medical Research, ch. 1.
- Wasserstein RL & Lazar NA (2016), The ASA’s Statement on p-Values.
Session info
R version 4.6.1 (2026-06-24)
Platform: x86_64-pc-linux-gnu
Running under: Ubuntu 26.04.1 LTS

Matrix products: default
BLAS:   /usr/lib/x86_64-linux-gnu/openblas-pthread/libblas.so.3
LAPACK: /usr/lib/x86_64-linux-gnu/openblas-pthread/libopenblasp-r0.3.32.so;  LAPACK version 3.12.0

locale:
 [1] LC_CTYPE=C.UTF-8       LC_NUMERIC=C           LC_TIME=C.UTF-8
 [4] LC_COLLATE=C.UTF-8     LC_MONETARY=C.UTF-8    LC_MESSAGES=C.UTF-8
 [7] LC_PAPER=C.UTF-8       LC_NAME=C              LC_ADDRESS=C
[10] LC_TELEPHONE=C         LC_MEASUREMENT=C.UTF-8 LC_IDENTIFICATION=C

time zone: UTC
tzcode source: system (glibc)

attached base packages:
[1] stats     graphics  grDevices datasets  utils     methods   base

other attached packages:
 [1] lubridate_1.9.5 forcats_1.0.1   stringr_1.6.0   dplyr_1.2.1
 [5] purrr_1.2.2     readr_2.2.0     tidyr_1.3.2     tibble_3.3.1
 [9] ggplot2_4.0.3   tidyverse_2.0.0

loaded via a namespace (and not attached):
 [1] gtable_0.3.6       jsonlite_2.0.0     compiler_4.6.1     renv_1.3.1
 [5] tidyselect_1.2.1   scales_1.4.0       yaml_2.3.12        fastmap_1.2.0
 [9] R6_2.6.1           labeling_0.4.3     generics_0.1.4     knitr_1.52
[13] pillar_1.11.1      RColorBrewer_1.1-3 tzdb_0.5.0         rlang_1.3.0
[17] stringi_1.8.9      xfun_0.62          S7_0.2.2           otel_0.2.0
[21] timechange_0.4.0   cli_3.6.6          withr_3.0.3        magrittr_2.0.5
[25] digest_0.6.39      grid_4.6.1         hms_1.1.4          lifecycle_1.0.5
[29] vctrs_0.7.3        evaluate_1.0.5     glue_1.8.1         farver_2.1.2
[33] rmarkdown_2.32     tools_4.6.1        pkgconfig_2.0.3    htmltools_0.5.9