Week 2, Session 1 — Descriptive statistics and Table 1

Course 1 — #courses

R. Heller

Note

Workflow labs use the variant template: Goal → Approach → Execution → Check → Report.

Learning objectives

  • Match the right summary statistic to the right variable type — means for symmetric continuous, medians for skewed, counts and percentages for categorical.
  • Build a publication-ready Table 1 with gtsummary::tbl_summary().
  • Defend the choice of summary with a quick visual check.

Prerequisites

Labs 1.3 through 1.5.

Background

Table 1 is the first real table of almost every clinical paper. It describes the sample: who was in the study, in how many groups, with what characteristics, and — if the study has arms — how balanced those arms are at baseline. A Table 1 that is built thoughtlessly hides an unbalanced comparison; a Table 1 that is built well anchors the rest of the paper.

The right summary depends on the variable. A continuous variable that is roughly symmetric is summarised by its mean and standard deviation; one that is skewed or has heavy tails is summarised by its median and interquartile range. A categorical variable is summarised by counts and percentages. Reporting the median of a balanced continuous variable is not wrong, but it is unusual; reporting the mean of a skewed variable is often misleading.

gtsummary packages these choices into a declarative API. You say which variables to include and which grouping variable to stratify by, and the table is built with sensible defaults. When you need non-standard behaviour, you override per-variable.

Setup

1. Goal

Produce a Table 1 for the penguins dataset stratified by species, and back the choice of summary with a diagnostic plot.

2. Approach

3. Execution

Pick the right summary per variable. First, eyeball the shapes.
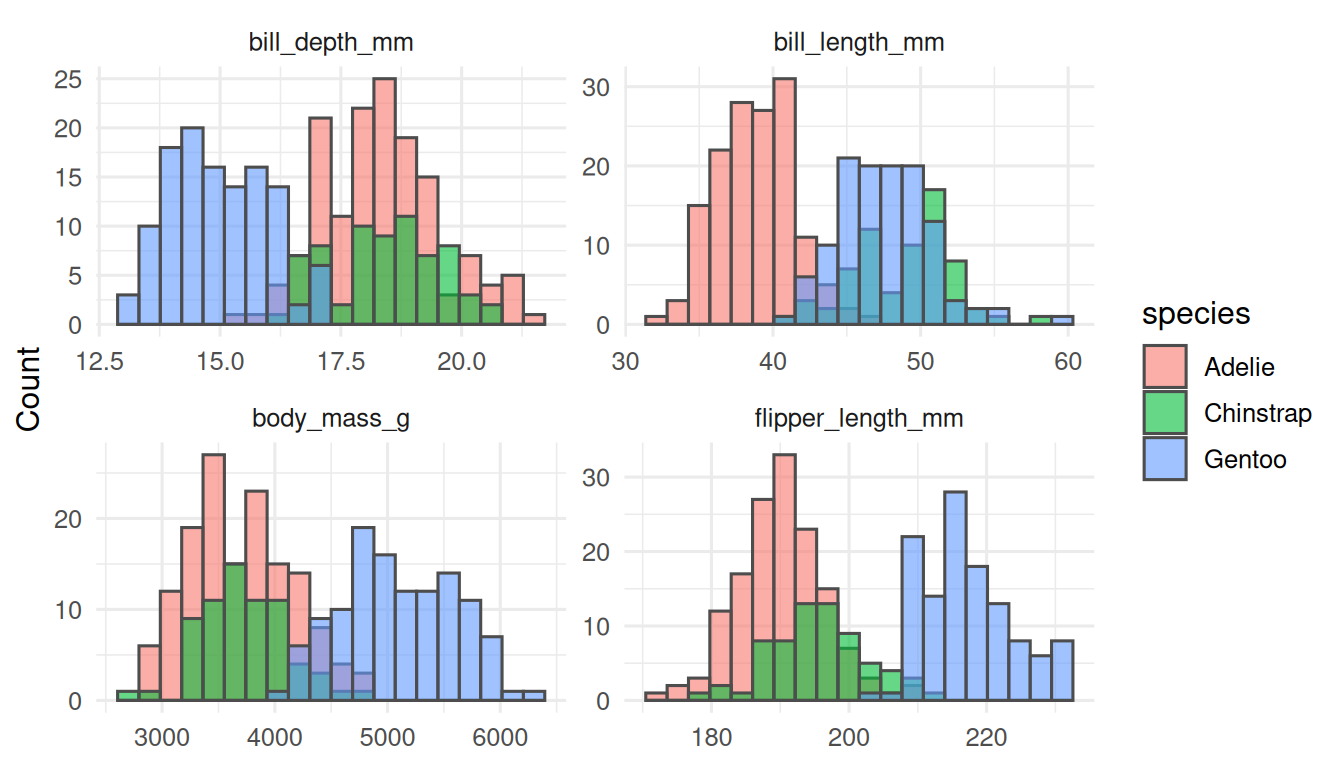
All four continuous variables are approximately symmetric within species, so mean (SD) is defensible. If a variable were skewed, we would switch to median (IQR).

Characteristic Overall
N = 3331
Adelie
N = 1461
Chinstrap
N = 681
Gentoo
N = 1191
p-value2
Sex


>0.9
    female 165 (50%) 73 (50%) 34 (50%) 58 (49%)
    male 168 (50%) 73 (50%) 34 (50%) 61 (51%)
Bill length (mm) 44.0 (5.5) 38.8 (2.7) 48.8 (3.3) 47.6 (3.1) <0.001
Bill depth (mm) 17.2 (2.0) 18.3 (1.2) 18.4 (1.1) 15.0 (1.0) <0.001
Flipper length (mm) 201.0 (14.0) 190.1 (6.5) 195.8 (7.1) 217.2 (6.6) <0.001
Body mass (g) 4,207.1 (805.2) 3,706.2 (458.6) 3,733.1 (384.3) 5,092.4 (501.5) <0.001
1 n (%); Mean (SD)
2 Pearson’s Chi-squared test; Kruskal-Wallis rank sum test

add_p() will run a t-test or ANOVA on continuous variables and a chi-square or Fisher’s exact test on categorical, with sensible defaults for sample size.

4. Check

Validate the gtsummary output against a hand computation.

# A tibble: 3 × 4
  species       n mean_mass sd_mass
  <fct>     <int>     <dbl>   <dbl>
1 Adelie      146     3706.    459.
2 Chinstrap    68     3733.    384.
3 Gentoo      119     5092.    501.

The group means and standard deviations must match the numbers in the body-mass row of the Table 1.

5. Report

Table 1 describes 333 penguins from three species in the Palmer Archipelago. Body mass was highest in Gentoo (5092 ± 501 g) and lower in Adelie and Chinstrap. All four continuous variables were approximately symmetric within species and are summarised as mean (SD); sex was approximately balanced within each species.

Table 1 is not a tool for hypothesis testing. The p-values in the rightmost column describe the data, not the biology. A statistically-significant difference between arms at baseline in a randomised trial is, by construction, a chance finding.

Common pitfalls

  • Reporting a mean for a skewed variable.
  • Using Table 1 as a place to “prove balance” with p-values in a randomised trial.
  • Suppressing the missing-data row. Always report it.
  • Forgetting that tbl_summary drops NAs by default; check the count at the bottom of each column.

Further reading

  • Sjoberg DD et al. Reproducible summary tables with the gtsummary package. R Journal.
  • Altman DG. Practical Statistics for Medical Research, chapter on describing data.

Session info

R version 4.6.1 (2026-06-24)
Platform: x86_64-pc-linux-gnu
Running under: Ubuntu 26.04.1 LTS

Matrix products: default
BLAS:   /usr/lib/x86_64-linux-gnu/openblas-pthread/libblas.so.3 
LAPACK: /usr/lib/x86_64-linux-gnu/openblas-pthread/libopenblasp-r0.3.32.so;  LAPACK version 3.12.0

locale:
 [1] LC_CTYPE=C.UTF-8       LC_NUMERIC=C           LC_TIME=C.UTF-8       
 [4] LC_COLLATE=C.UTF-8     LC_MONETARY=C.UTF-8    LC_MESSAGES=C.UTF-8   
 [7] LC_PAPER=C.UTF-8       LC_NAME=C              LC_ADDRESS=C          
[10] LC_TELEPHONE=C         LC_MEASUREMENT=C.UTF-8 LC_IDENTIFICATION=C   

time zone: UTC
tzcode source: system (glibc)

attached base packages:
[1] stats     graphics  grDevices datasets  utils     methods   base     

other attached packages:
 [1] gtsummary_2.6.1      palmerpenguins_0.1.1 lubridate_1.9.5     
 [4] forcats_1.0.1        stringr_1.6.0        dplyr_1.2.1         
 [7] purrr_1.2.2          readr_2.2.0          tidyr_1.3.2         
[10] tibble_3.3.1         ggplot2_4.0.3        tidyverse_2.0.0     

loaded via a namespace (and not attached):
 [1] gt_1.4.0           utf8_1.2.6         sass_0.4.10        generics_0.1.4    
 [5] renv_1.3.1         xml2_1.6.0         stringi_1.8.9      hms_1.1.4         
 [9] digest_0.6.39      magrittr_2.0.5     evaluate_1.0.5     grid_4.6.1        
[13] timechange_0.4.0   RColorBrewer_1.1-3 cards_0.9.0        fastmap_1.2.0     
[17] jsonlite_2.0.0     cardx_0.3.4        backports_1.5.1    scales_1.4.0      
[21] cli_3.6.6          rlang_1.3.0        litedown_0.11      commonmark_2.0.0  
[25] base64enc_0.1-6    withr_3.0.3        yaml_2.3.12        otel_0.2.0        
[29] tools_4.6.1        tzdb_0.5.0         broom_1.0.13       vctrs_0.7.3       
[33] R6_2.6.1           lifecycle_1.0.5    fs_2.1.0           pkgconfig_2.0.3   
[37] pillar_1.11.1      gtable_0.3.6       glue_1.8.1         xfun_0.62         
[41] tidyselect_1.2.1   knitr_1.52         farver_2.1.2       htmltools_0.5.9   
[45] rmarkdown_2.32     labeling_0.4.3     compiler_4.6.1     S7_0.2.2          
[49] markdown_2.1