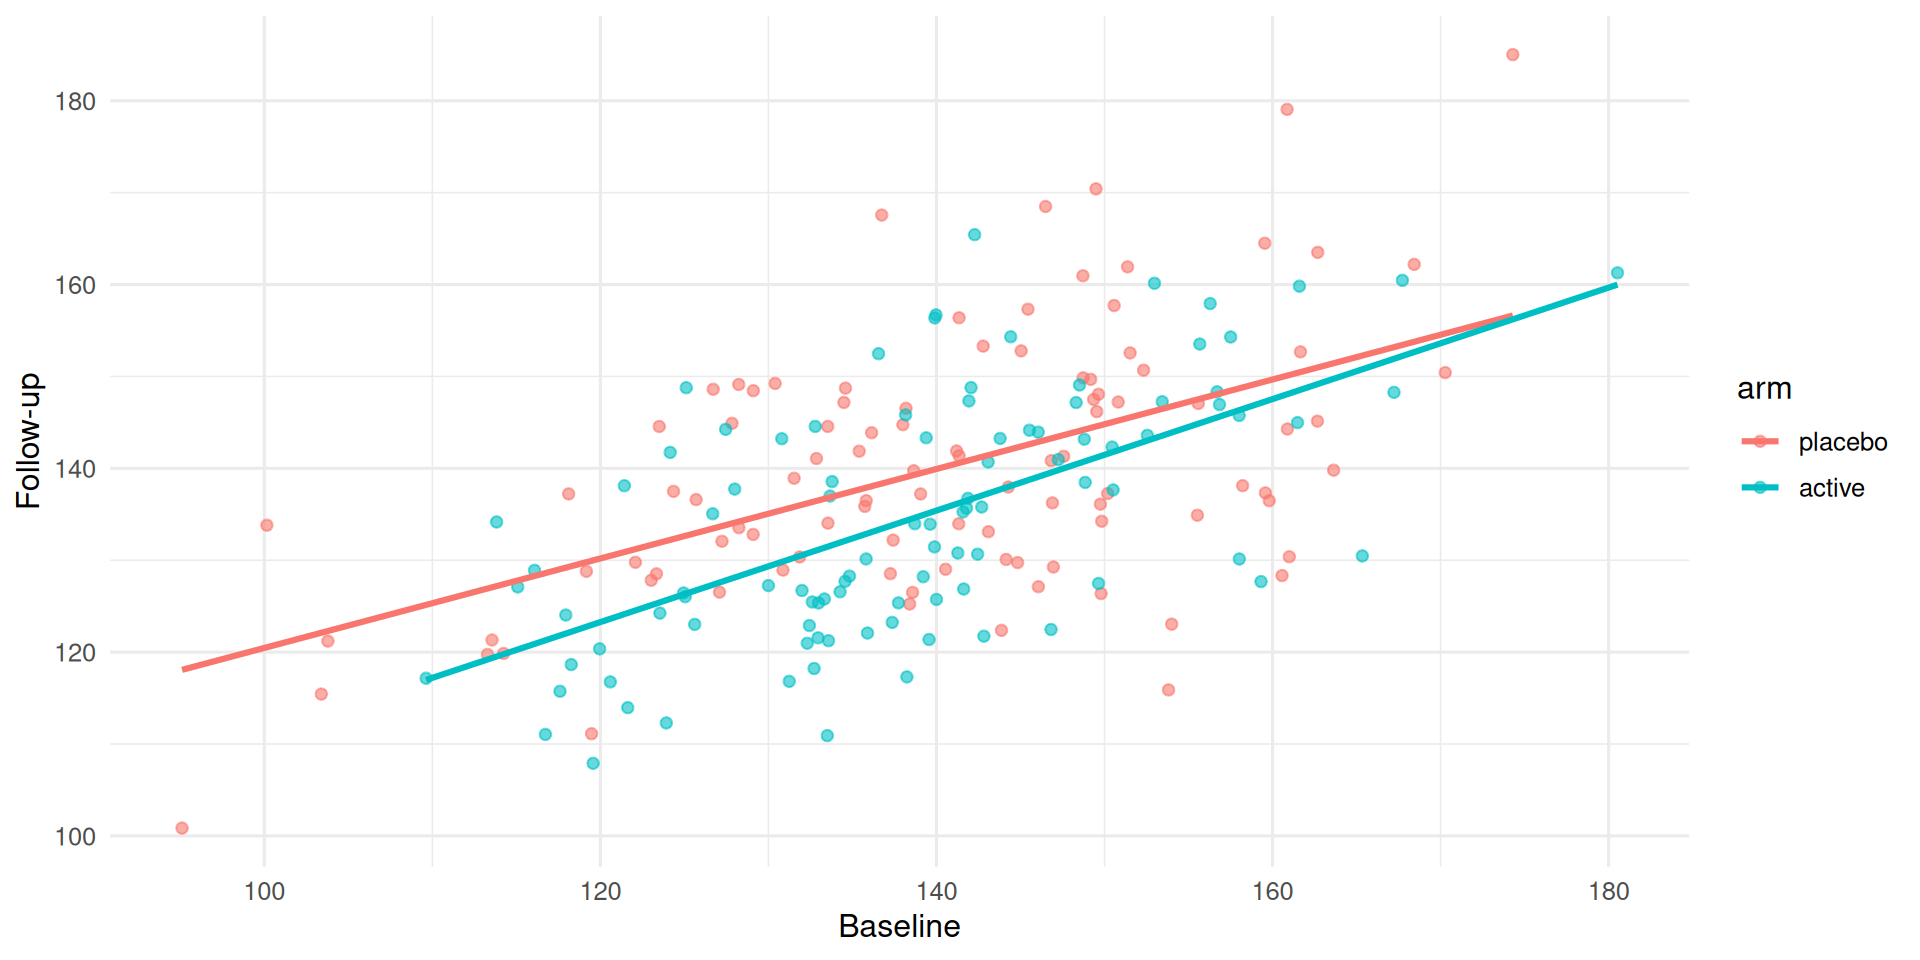
# A tibble: 1 × 5
  term               estimate std.error statistic p.value
  <chr>                 <dbl>     <dbl>     <dbl>   <dbl>
1 armactive:baseline 0.120 0.112 1.07 0.285Week 3, Session 2 — ANCOVA in RCTs (baseline adjustment)
Course 2 — #courses
R. Heller
Note
Inference labs use the five-step template: Hypothesis → Visualise → Assumptions → Conduct → Conclude.
Learning objectives
- Choose between change scores, post-only, and ANCOVA in an RCT analysis plan.
- Fit an ANCOVA model and read the treatment effect as an adjusted-mean difference.
- Show that ANCOVA is more efficient than the change-score approach when baseline and follow-up are correlated.
Prerequisites
Week 1 regression; Week 2 one-way ANOVA.
Background
In a randomised trial with a continuous outcome measured at baseline and follow-up, three analyses are common: compare the post-intervention means, compare the change scores, or use analysis of covariance (ANCOVA) with baseline as a covariate. Randomisation ensures all three are unbiased in expectation, but they are not equally efficient.
ANCOVA weights the baseline by its observed correlation with the follow-up and is therefore always at least as efficient as the change-score approach, and much more efficient when that correlation is moderate. Change scores are equivalent to ANCOVA with the baseline slope constrained to 1; post-only is ANCOVA with the slope constrained to 0. When neither constraint matches the data, efficiency is lost.
Regression to the mean (Week 4 Session 1) is the mechanical reason ANCOVA wins. Patients with unusually high baselines tend to have lower follow-ups whether they are treated or not; ANCOVA uses that pattern, change-score analysis pretends it does not exist.
Setup
1. Hypothesis
Simulate a trial with baseline and follow-up correlated at r = 0.6, then compare the three analyses.
2. Visualise
3. Assumptions
Randomisation; linear relationship between baseline and follow-up; equal slopes across arms (tested with an interaction term).
If the interaction is small, pool the slopes in the ANCOVA.
4. Conduct
# A tibble: 3 × 5
  model     estimate std.error conf.low conf.high
  <chr>        <dbl>     <dbl>    <dbl>     <dbl>
1 post only    -5.56      1.95    -9.41   -1.71
2 change       -3.76      1.87    -7.44   -0.0760
3 ANCOVA       -4.59      1.61    -7.77   -1.41
The three estimates should all be around −5; the ANCOVA standard error should be the smallest.
5. Concluding statement
In a simulated trial (n = 200), ANCOVA estimated the treatment effect at -4.59 units (95% CI -7.77 to -1.41) with a smaller standard error than either the post-only or change-score analyses. ANCOVA is the prespecified primary analysis in most continuous-outcome RCTs.
Common pitfalls
- Adjusting for post-baseline covariates (not covered here, but a classic trap).
- Using a change score when baseline and follow-up are strongly correlated.
- Dropping observations with missing baselines instead of imputing or prespecifying a policy.
Further reading
- Senn S (2006), Change from baseline and analysis of covariance…
- Vickers AJ, Altman DG (2001), Analysing controlled trials with…
- ICH E9 (R1) Addendum on Estimands.
Session info
R version 4.6.1 (2026-06-24)
Platform: x86_64-pc-linux-gnu
Running under: Ubuntu 26.04.1 LTS

Matrix products: default
BLAS:   /usr/lib/x86_64-linux-gnu/openblas-pthread/libblas.so.3
LAPACK: /usr/lib/x86_64-linux-gnu/openblas-pthread/libopenblasp-r0.3.32.so;  LAPACK version 3.12.0

locale:
 [1] LC_CTYPE=C.UTF-8       LC_NUMERIC=C           LC_TIME=C.UTF-8
 [4] LC_COLLATE=C.UTF-8     LC_MONETARY=C.UTF-8    LC_MESSAGES=C.UTF-8
 [7] LC_PAPER=C.UTF-8       LC_NAME=C              LC_ADDRESS=C
[10] LC_TELEPHONE=C         LC_MEASUREMENT=C.UTF-8 LC_IDENTIFICATION=C

time zone: UTC
tzcode source: system (glibc)

attached base packages:
[1] stats     graphics  grDevices datasets  utils     methods   base

other attached packages:
 [1] broom_1.0.13    lubridate_1.9.5 forcats_1.0.1   stringr_1.6.0
 [5] dplyr_1.2.1     purrr_1.2.2     readr_2.2.0     tidyr_1.3.2
 [9] tibble_3.3.1    ggplot2_4.0.3   tidyverse_2.0.0

loaded via a namespace (and not attached):
 [1] Matrix_1.7-5       gtable_0.3.6       jsonlite_2.0.0     compiler_4.6.1
 [5] renv_1.3.1         tidyselect_1.2.1   splines_4.6.1      scales_1.4.0
 [9] yaml_2.3.12        fastmap_1.2.0      lattice_0.22-9     R6_2.6.1
[13] labeling_0.4.3     generics_0.1.4     knitr_1.52         backports_1.5.1
[17] pillar_1.11.1      RColorBrewer_1.1-3 tzdb_0.5.0         rlang_1.3.0
[21] utf8_1.2.6         stringi_1.8.9      xfun_0.62          S7_0.2.2
[25] otel_0.2.0         timechange_0.4.0   cli_3.6.6          mgcv_1.9-4
[29] withr_3.0.3        magrittr_2.0.5     digest_0.6.39      grid_4.6.1
[33] hms_1.1.4          nlme_3.1-169       lifecycle_1.0.5    vctrs_0.7.3
[37] evaluate_1.0.5     glue_1.8.1         farver_2.1.2       rmarkdown_2.32
[41] tools_4.6.1        pkgconfig_2.0.3    htmltools_0.5.9