Week 4, Session 4 — Decision curves, NRI, IDI
Course 2 — #courses
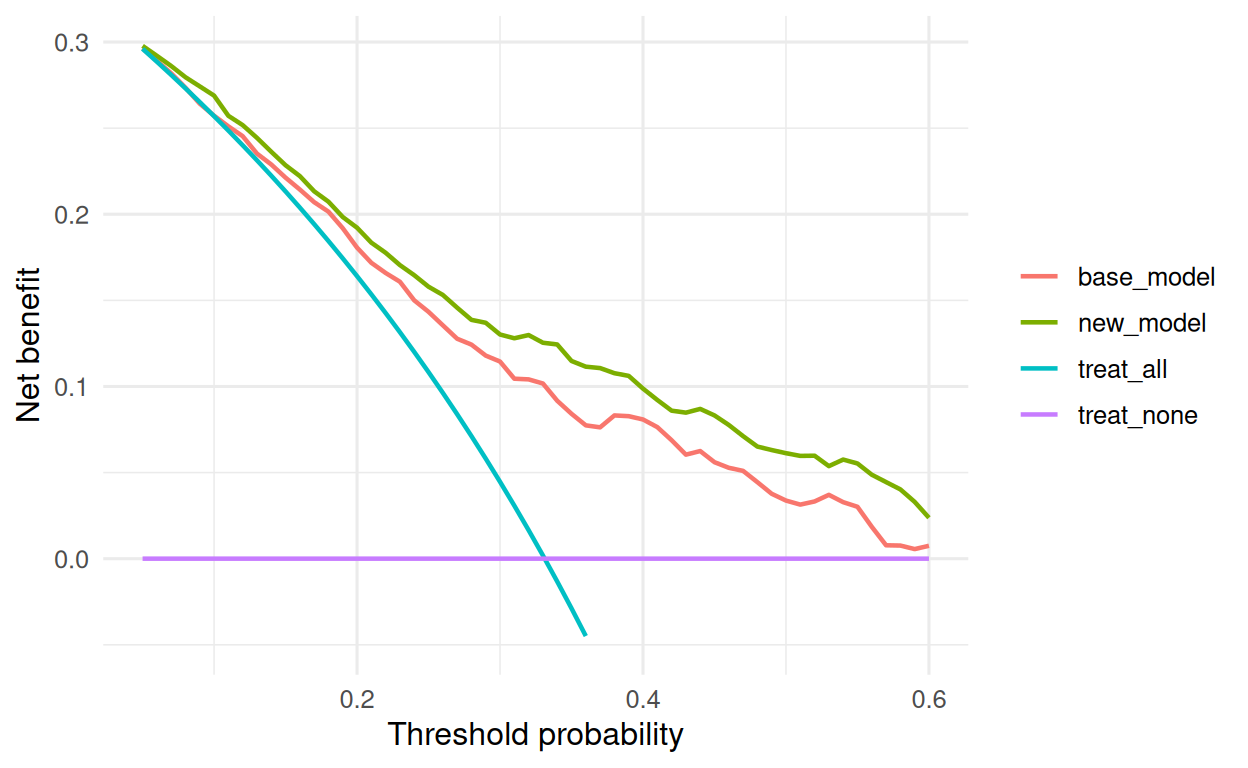
3. Execution — decision curve (hand-coded)
net_benefit <- function(y, p, thr) {
  n <- length(y)
  pred_pos <- p >= thr
  tp <- sum(pred_pos &  y == 1)
  fp <- sum(pred_pos &  y == 0)
  tp / n - fp / n * (thr / (1 - thr))
}

thresholds <- seq(0.05, 0.6, by = 0.01)
dc <- tibble(
  threshold    = thresholds,
  base_model   = sapply(thresholds, \(t) net_benefit(df$y, df$p_base, t)),
  new_model    = sapply(thresholds, \(t) net_benefit(df$y, df$p_new,  t)),
  treat_all    = sapply(thresholds, \(t)
                         mean(df$y) - (1 - mean(df$y)) * t / (1 - t)),
  treat_none   = 0
) |>
  pivot_longer(-threshold, names_to = "strategy", values_to = "net_benefit")