Week 4, Session 1 — Systematic reviews and PRISMA

Course 3 — #courses

R. Heller

Note

Workflow lab: Goal → Approach → Execution → Check → Report.

Learning objectives

  • Frame a systematic-review question using PICO.
  • Draft a reproducible search strategy across at least two databases.
  • Produce a PRISMA flow diagram from counts at each screening stage.

Prerequisites

None beyond reading a paper.

Background

A systematic review is itself a study: it has a protocol, a pre-specified search strategy, explicit inclusion and exclusion criteria, and a plan for synthesis. The PRISMA 2020 statement is the reporting standard, which means the diagram showing what you searched, what you excluded, and why is not optional. PROSPERO (https://www.crd.york.ac.uk/prospero/) is the standard registry for review protocols — registering early protects you from post-hoc drift.

Good search strategies combine controlled-vocabulary terms (MeSH on PubMed, Emtree on Embase) with free-text terms, connect concepts with Boolean AND, and expand synonyms with OR. A librarian-reviewed strategy typically outperforms a DIY one by a wide margin in recall; co-authoring with a health-sciences librarian is the single best investment in review quality.

Setup

library(tidyverse)
set.seed(42)
theme_set(theme_minimal(base_size = 12))

1. Goal

Illustrate a PICO-framed question, sketch a search strategy, and simulate screening counts to generate a PRISMA flow diagram.

2. Approach

A fictional question in PICO form:

In adults with type 2 diabetes (P), does metformin (I) compared with placebo (C) reduce all-cause mortality (O) at 24 months?

A sketch of a search strategy (PubMed syntax):

("Diabetes Mellitus, Type 2"[MeSH] OR "type 2 diabetes"[tiab])
AND (metformin[MeSH] OR metformin[tiab])
AND (randomised[tiab] OR randomized[tiab] OR trial[tiab] OR RCT[tiab])

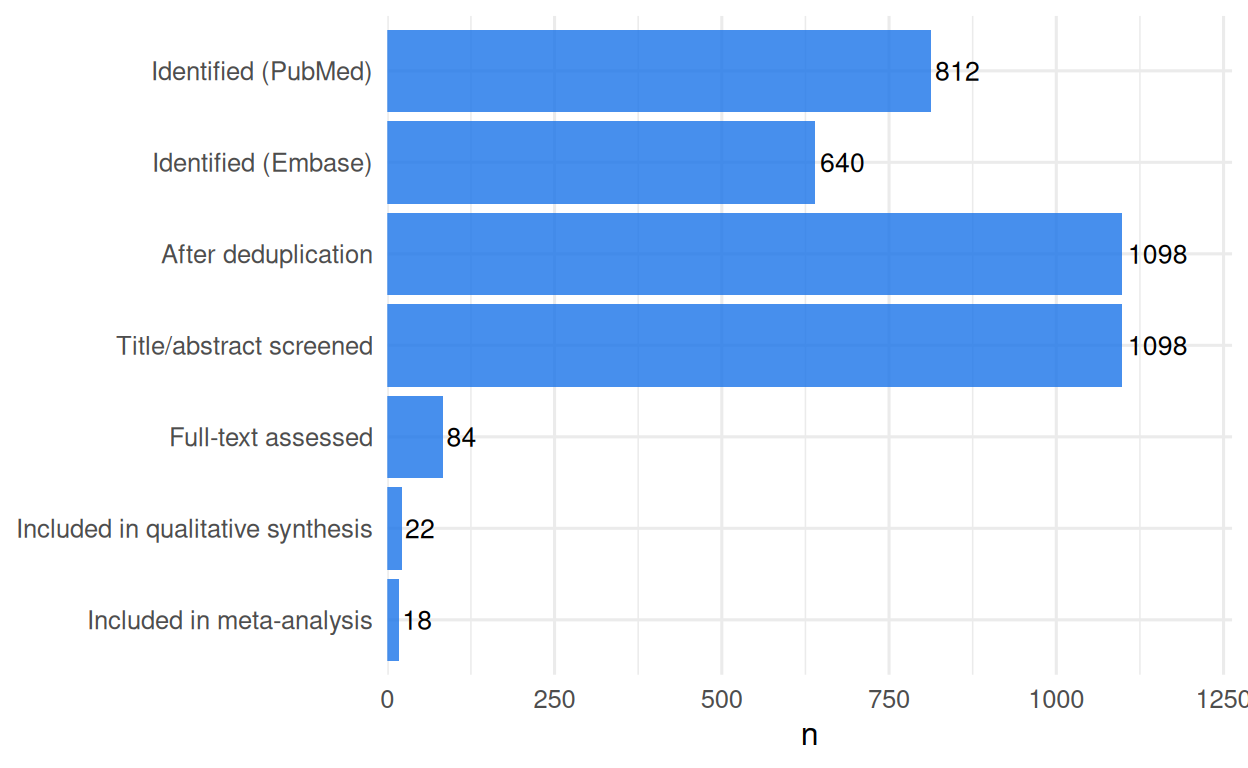
3. Execution — simulated screening counts

prisma <- tibble(
  stage = c("Identified (PubMed)", "Identified (Embase)",
            "After deduplication",
            "Title/abstract screened", "Full-text assessed",
            "Included in qualitative synthesis",
            "Included in meta-analysis"),
  n = c(812, 640, 1098, 1098, 84, 22, 18)
)
prisma
# A tibble: 7 × 2
  stage                                 n
  <chr>                             <dbl>
1 Identified (PubMed)                 812
2 Identified (Embase)                 640
3 After deduplication                1098
4 Title/abstract screened            1098
5 Full-text assessed                   84
6 Included in qualitative synthesis    22
7 Included in meta-analysis            18
prisma |>
  mutate(stage = factor(stage, levels = rev(stage))) |>
  ggplot(aes(n, stage)) +
  geom_col(fill = "#1a73e8", alpha = 0.8) +
  geom_text(aes(label = n), hjust = -0.1, size = 3.5) +
  scale_x_continuous(expand = expansion(mult = c(0, 0.15))) +
  labs(x = "n", y = NULL)

4. Check

PRISMA 2020 checklist pointer (items most often missed):

  • Item 5: eligibility criteria pre-specified.
  • Item 6: information sources with date of last search.
  • Item 7: complete search strategy for every database, including limits.
  • Item 16a: reasons for excluding full-text articles.

5. Report

A systematic review of the effect of metformin on all-cause mortality in adults with type 2 diabetes was conducted following PRISMA 2020. Database searches identified 812 records from PubMed and 640 from Embase. After deduplication, 1098 records were screened by title and abstract; 84 full texts were assessed, and 22 studies were included in the qualitative synthesis, of which 18 were pooled by meta-analysis.

Common pitfalls

  • Ad-hoc searches that cannot be re-run.
  • Failing to double-screen at each stage (reviewer drift).
  • Reporting included-study counts without the flow that produced them.

Further reading

  • Page MJ et al. (2021). The PRISMA 2020 statement. BMJ.
  • Cochrane Handbook for Systematic Reviews of Interventions.

Session info

sessionInfo()
R version 4.4.1 (2024-06-14)
Platform: x86_64-pc-linux-gnu
Running under: Ubuntu 24.04.4 LTS

Matrix products: default
BLAS:   /usr/lib/x86_64-linux-gnu/openblas-pthread/libblas.so.3 
LAPACK: /usr/lib/x86_64-linux-gnu/openblas-pthread/libopenblasp-r0.3.26.so;  LAPACK version 3.12.0

locale:
 [1] LC_CTYPE=C.UTF-8       LC_NUMERIC=C           LC_TIME=C.UTF-8       
 [4] LC_COLLATE=C.UTF-8     LC_MONETARY=C.UTF-8    LC_MESSAGES=C.UTF-8   
 [7] LC_PAPER=C.UTF-8       LC_NAME=C              LC_ADDRESS=C          
[10] LC_TELEPHONE=C         LC_MEASUREMENT=C.UTF-8 LC_IDENTIFICATION=C   

time zone: UTC
tzcode source: system (glibc)

attached base packages:
[1] stats     graphics  grDevices utils     datasets  methods   base     

other attached packages:
 [1] lubridate_1.9.5 forcats_1.0.1   stringr_1.6.0   dplyr_1.2.1    
 [5] purrr_1.2.2     readr_2.2.0     tidyr_1.3.2     tibble_3.3.1   
 [9] ggplot2_4.0.3   tidyverse_2.0.0

loaded via a namespace (and not attached):
 [1] gtable_0.3.6       jsonlite_2.0.0     compiler_4.4.1     tidyselect_1.2.1  
 [5] scales_1.4.0       yaml_2.3.12        fastmap_1.2.0      R6_2.6.1          
 [9] labeling_0.4.3     generics_0.1.4     knitr_1.51         htmlwidgets_1.6.4 
[13] pillar_1.11.1      RColorBrewer_1.1-3 tzdb_0.5.0         rlang_1.2.0       
[17] utf8_1.2.6         stringi_1.8.7      xfun_0.57          S7_0.2.2          
[21] otel_0.2.0         timechange_0.4.0   cli_3.6.6          withr_3.0.2       
[25] magrittr_2.0.5     digest_0.6.39      grid_4.4.1         hms_1.1.4         
[29] lifecycle_1.0.5    vctrs_0.7.3        evaluate_1.0.5     glue_1.8.1        
[33] farver_2.1.2       rmarkdown_2.31     tools_4.4.1        pkgconfig_2.0.3   
[37] htmltools_0.5.9