Week 4, Session 3 — Network meta-analysis
Course 3 — #courses
Note
Inference lab: Hypothesis → Visualise → Assumptions → Conduct → Conclude.
Learning objectives
- Fit a network meta-analysis (NMA) using
netmeta. - Draw and read the network graph.
- Derive SUCRA rankings and interpret them cautiously.
Prerequisites
Pairwise meta-analysis (W4 S2).
Background
Network meta-analysis extends pairwise meta-analysis to more than two treatments by combining direct comparisons (from head-to-head trials) with indirect comparisons (inferred through a shared comparator). The central assumption is transitivity: the studies compared indirectly are exchangeable — no moderator distinguishes them in a way that systematically shifts the effect. The statistical analogue, consistency, checks whether direct and indirect estimates agree.
SUCRA (surface under the cumulative ranking curve) summarises each treatment’s rank distribution on a 0-1 scale, where 1 is best. SUCRA values compress a lot of uncertainty into a single number; they are useful for signalling but should be reported with interval estimates for every pairwise comparison.
Setup
1. Hypothesis
H₀: all treatments in the network have equal efficacy. H₁: at least two differ.
2. Visualise
     TE   seTE   treat1.long treat2.long treat1 treat2           studlab
1 -1.90 0.1414     Metformin     Placebo   metf   plac      DeFronzo1995
2 -0.82 0.0992     Metformin     Placebo   metf   plac         Lewin2007
3 -0.20 0.3579     Metformin    Acarbose   metf   acar        Willms1999
4 -1.34 0.1435 Rosiglitazone     Placebo   rosi   plac      Davidson2007
5 -1.10 0.1141 Rosiglitazone     Placebo   rosi   plac Wolffenbuttel1999
6 -1.30 0.1268  Pioglitazone     Placebo   piog   plac        Kipnes2001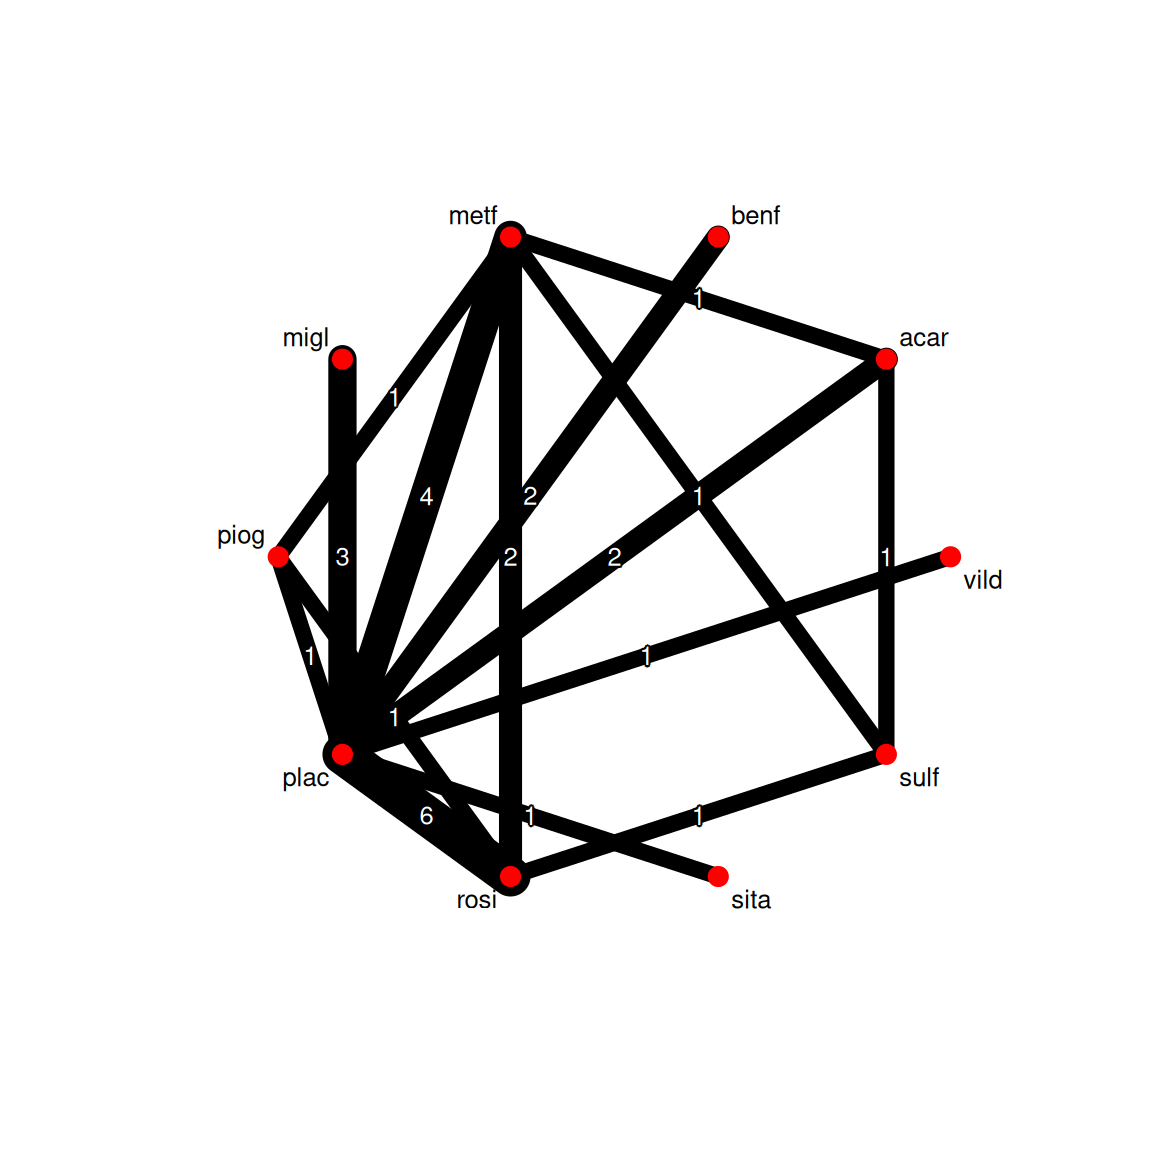
3. Assumptions
Q statistics to assess homogeneity / consistency

                    Q df  p-value
Total           96.99 18 < 0.0001
Within designs  74.46 11 < 0.0001
Between designs 22.53  7   0.0021

Design-specific decomposition of within-designs Q statistic

    Design     Q df  p-value
 plac:metf 42.16  2 < 0.0001
 plac:rosi 21.27  5   0.0007
 plac:benf  4.38  1   0.0363
 plac:migl  6.45  2   0.0398
 metf:rosi  0.19  1   0.6655

Between-designs Q statistic after detaching of single designs
(influential designs have p-value markedly different from 0.0021)

 Detached design     Q df p-value
       rosi:sulf  6.77  6  0.3425
       metf:sulf  7.51  6  0.2760
       plac:rosi 16.29  6  0.0123
       metf:piog 17.13  6  0.0088
       plac:piog 17.25  6  0.0084
       plac:metf 22.07  6  0.0012
       plac:acar 22.44  6  0.0010
       piog:rosi 22.48  6  0.0010
       acar:sulf 22.52  6  0.0010
       metf:rosi 22.52  6  0.0010
  plac:acar:metf 22.38  5  0.0004

Q statistic to assess consistency under the assumption of
a full design-by-treatment interaction random effects model

                   Q df p-value tau.within tau2.within
Between designs 2.19  7  0.9483     0.3797      0.1442
The within-design heterogeneity and between-design inconsistency variances are the key diagnostics.
4. Conduct
Original data (with adjusted standard errors for multi-arm studies):

                   treat1 treat2      TE   seTE seTE.adj narms multiarm
DeFronzo1995         metf   plac -1.9000 0.1414   0.3588     2
Lewin2007            metf   plac -0.8200 0.0992   0.3443     2
Willms1999           acar   metf  0.2000 0.3579   0.5574     3        *
Davidson2007         plac   rosi  1.3400 0.1435   0.3596     2
Wolffenbuttel1999    plac   rosi  1.1000 0.1141   0.3489     2
Kipnes2001           piog   plac -1.3000 0.1268   0.3533     2
Kerenyi2004          plac   rosi  0.7700 0.1078   0.3469     2
Hanefeld2004         metf   piog -0.1600 0.0849   0.3405     2
Derosa2004           piog   rosi  0.1000 0.1831   0.3772     2
Baksi2004            plac   rosi  1.3000 0.1014   0.3450     2
Rosenstock2008       plac   rosi  1.0900 0.2263   0.3999     2
Zhu2003              plac   rosi  1.5000 0.1624   0.3675     2
Yang2003             metf   rosi  0.1400 0.2239   0.3986     2
Vongthavaravat2002   rosi   sulf -1.2000 0.1436   0.3596     2
Oyama2008            acar   sulf -0.4000 0.1549   0.3643     2
Costa1997            acar   plac -0.8000 0.1432   0.3595     2
Hermansen2007        plac   sita  0.5700 0.1291   0.3541     2
Garber2008           plac   vild  0.7000 0.1273   0.3534     2
Alex1998             metf   sulf -0.3700 0.1184   0.3503     2
Johnston1994         migl   plac -0.7400 0.1839   0.3775     2
Johnston1998a        migl   plac -1.4100 0.2235   0.3983     2
Kim2007              metf   rosi -0.0000 0.2339   0.4043     2
Johnston1998b        migl   plac -0.6800 0.2828   0.4344     2
Gonzalez-Ortiz2004   metf   plac -0.4000 0.4356   0.5463     2
Stucci1996           benf   plac -0.2300 0.3467   0.4785     2
Moulin2006           benf   plac -1.0100 0.1366   0.3569     2
Willms1999           metf   plac -1.2000 0.3758   0.5802     3        *
Willms1999           acar   plac -1.0000 0.4669   0.8122     3        *

Number of treatment arms per study (by decreasing number of arms):
                   narms multiarm
Willms1999             3        *
DeFronzo1995           2
Lewin2007              2
Davidson2007           2
Wolffenbuttel1999      2
Kipnes2001             2
Kerenyi2004            2
Hanefeld2004           2
Derosa2004             2
Baksi2004              2
Rosenstock2008         2
Zhu2003                2
Yang2003               2
Vongthavaravat2002     2
Oyama2008              2
Costa1997              2
Hermansen2007          2
Garber2008             2
Alex1998               2
Johnston1994           2
Johnston1998a          2
Kim2007                2
Johnston1998b          2
Gonzalez-Ortiz2004     2
Stucci1996             2
Moulin2006             2

Results (random effects model):

                   treat1 treat2      MD             95%-CI
DeFronzo1995         metf   plac -1.1268 [-1.4291; -0.8244]
Lewin2007            metf   plac -1.1268 [-1.4291; -0.8244]
Willms1999           acar   metf  0.2850 [-0.2208;  0.7908]
Davidson2007         plac   rosi  1.2335 [ 0.9830;  1.4839]
Wolffenbuttel1999    plac   rosi  1.2335 [ 0.9830;  1.4839]
Kipnes2001           piog   plac -1.1291 [-1.5596; -0.6986]
Kerenyi2004          plac   rosi  1.2335 [ 0.9830;  1.4839]
Hanefeld2004         metf   piog  0.0023 [-0.4398;  0.4444]
Derosa2004           piog   rosi  0.1044 [-0.3347;  0.5435]
Baksi2004            plac   rosi  1.2335 [ 0.9830;  1.4839]
Rosenstock2008       plac   rosi  1.2335 [ 0.9830;  1.4839]
Zhu2003              plac   rosi  1.2335 [ 0.9830;  1.4839]
Yang2003             metf   rosi  0.1067 [-0.2170;  0.4304]
Vongthavaravat2002   rosi   sulf -0.8169 [-1.2817; -0.3521]
Oyama2008            acar   sulf -0.4252 [-0.9456;  0.0951]
Costa1997            acar   plac -0.8418 [-1.3236; -0.3600]
Hermansen2007        plac   sita  0.5700 [-0.1240;  1.2640]
Garber2008           plac   vild  0.7000 [ 0.0073;  1.3927]
Alex1998             metf   sulf -0.7102 [-1.1713; -0.2491]
Johnston1994         migl   plac -0.9497 [-1.4040; -0.4955]
Johnston1998a        migl   plac -0.9497 [-1.4040; -0.4955]
Kim2007              metf   rosi  0.1067 [-0.2170;  0.4304]
Johnston1998b        migl   plac -0.9497 [-1.4040; -0.4955]
Gonzalez-Ortiz2004   metf   plac -1.1268 [-1.4291; -0.8244]
Stucci1996           benf   plac -0.7311 [-1.2918; -0.1705]
Moulin2006           benf   plac -0.7311 [-1.2918; -0.1705]
Willms1999           metf   plac -1.1268 [-1.4291; -0.8244]
Willms1999           acar   plac -0.8418 [-1.3236; -0.3600]

Number of studies: k = 26
Number of pairwise comparisons: m = 28
Number of treatments: n = 10
Number of designs: d = 15

Random effects model

Treatment estimate (other treatments vs 'plac'):
          MD             95%-CI     z  p-value
acar -0.8418 [-1.3236; -0.3600] -3.42   0.0006
benf -0.7311 [-1.2918; -0.1705] -2.56   0.0106
metf -1.1268 [-1.4291; -0.8244] -7.30 < 0.0001
migl -0.9497 [-1.4040; -0.4955] -4.10 < 0.0001
piog -1.1291 [-1.5596; -0.6986] -5.14 < 0.0001
plac       .                  .     .        .
rosi -1.2335 [-1.4839; -0.9830] -9.65 < 0.0001
sita -0.5700 [-1.2640;  0.1240] -1.61   0.1075
sulf -0.4166 [-0.8887;  0.0556] -1.73   0.0838
vild -0.7000 [-1.3927; -0.0073] -1.98   0.0476

Quantifying heterogeneity / inconsistency:
tau^2 = 0.1087; tau = 0.3297; I^2 = 81.4% [72.0%; 87.7%]

Tests of heterogeneity (within designs) and inconsistency (between designs):
                    Q d.f.  p-value
Total           96.99   18 < 0.0001
Within designs  74.46   11 < 0.0001
Between designs 22.53    7   0.0021

Details of network meta-analysis methods:
- Frequentist graph-theoretical approach
- DerSimonian-Laird estimator for tau^2
- Calculation of I^2 based on Q P-score
rosi 0.8934
metf 0.7818
piog 0.7746
migl 0.6137
acar 0.5203
benf 0.4358
vild 0.4232
sita 0.3331
sulf 0.2103
plac 0.01395. Concluding statement
In a network meta-analysis of 10 treatments across 26 studies (28 pairwise comparisons), the treatment with the highest SUCRA for HbA1c lowering was rosi (SUCRA = 0.89). SUCRA rankings should be interpreted alongside the pairwise effect estimates and their intervals, not as a standalone conclusion.
Common pitfalls
- Treating SUCRA as if it were the effect size.
- Ignoring the transitivity assumption because the output compiled.
- Mixing direct and indirect evidence without quantifying inconsistency.
Further reading
- Rücker G, Schwarzer G. (2015). Ranking treatments in frequentist network meta-analysis.
- Salanti G. (2012). Indirect and mixed-treatment comparison…
Session info
R version 4.5.2 (2025-10-31 ucrt)
Platform: x86_64-w64-mingw32/x64
Running under: Windows 11 x64 (build 26200)

Matrix products: default
  LAPACK version 3.12.1

locale:
[1] LC_COLLATE=English_Germany.utf8  LC_CTYPE=English_Germany.utf8
[3] LC_MONETARY=English_Germany.utf8 LC_NUMERIC=C
[5] LC_TIME=English_Germany.utf8

time zone: Europe/Berlin
tzcode source: internal

attached base packages:
[1] stats     graphics  grDevices utils     datasets  methods   base

other attached packages:
 [1] netmeta_3.4-0   meta_8.3-0      metadat_1.6-0   metabook_0.2-0
 [5] lubridate_1.9.5 forcats_1.0.1   stringr_1.6.0   dplyr_1.2.1
 [9] purrr_1.2.2     readr_2.2.0     tidyr_1.3.2     tibble_3.3.1
[13] ggplot2_4.0.3   tidyverse_2.0.0

loaded via a namespace (and not attached):
 [1] gtable_0.3.6        xfun_0.57           htmlwidgets_1.6.4
 [4] CompQuadForm_1.4.4  lattice_0.22-9      mathjaxr_2.0-0
 [7] tzdb_0.5.0          numDeriv_2016.8-1.1 vctrs_0.7.3
[10] tools_4.5.2         Rdpack_2.6.6        generics_0.1.4
[13] rgl_1.3.36          pkgconfig_2.0.3     Matrix_1.7-5
[16] RColorBrewer_1.1-3  S7_0.2.2            lifecycle_1.0.5
[19] compiler_4.5.2      farver_2.1.2        htmltools_0.5.9
[22] yaml_2.3.12         pillar_1.11.1       nloptr_2.2.1
[25] MASS_7.3-65         reformulas_0.4.4    abind_1.4-8
[28] boot_1.3-32         nlme_3.1-169        tidyselect_1.2.1
[31] digest_0.6.39       mvtnorm_1.3-7       stringi_1.8.7
[34] splines_4.5.2       magic_1.6-1         fastmap_1.2.0
[37] grid_4.5.2          colorspace_2.1-2    cli_3.6.6
[40] metafor_5.0-1       magrittr_2.0.4      base64enc_0.1-6
[43] withr_3.0.2         scales_1.4.0        timechange_0.4.0
[46] rmarkdown_2.31      igraph_2.3.1        otel_0.2.0
[49] lme4_2.0-1          hms_1.1.4           evaluate_1.0.5
[52] knitr_1.51          rbibutils_2.4.1     rlang_1.2.0
[55] Rcpp_1.1.1-1.1      glue_1.8.1          xml2_1.5.2
[58] minqa_1.2.8         jsonlite_2.0.0      R6_2.6.1