Course 3 — #courses
Note
Workflow lab: Goal → Approach → Execution → Check → Report.
deSolve::ode and plot the trajectories.Basic calculus intuition and comfort with differential-equation notation.
Compartmental models partition a population into states — Susceptible, Exposed, Infectious, Recovered — and describe flows between them with ordinary differential equations. The SIR model has three compartments and two parameters (transmission rate β, recovery rate γ); the SEIR model adds an exposed-but-not-yet-infectious class and a progression rate σ. These models are caricatures, but they capture the shape of an epidemic — exponential rise, peak, decline — surprisingly well, and they make the role of R₀ = β/γ visible.
The real power of compartmental models in practice is not prediction but counterfactual reasoning: what if we had vaccinated half the population on day zero, or what if the infectious period were a day shorter? Tuning β and γ to reflect interventions is the bread and butter of public-health modelling.
Simulate an SIR outbreak in a population of 1 million, for R₀ values 1.5, 2.5, and 4.
run_sir <- function(R0, gamma = 1/7, days = 180, N = 1e6, I0 = 10) {
params <- c(beta = R0 * gamma, gamma = gamma)
state <- c(S = N - I0, I = I0, R = 0)
times <- seq(0, days, by = 1)
out <- as.data.frame(ode(state, times, sir, params))
out$R0 <- R0
out
}
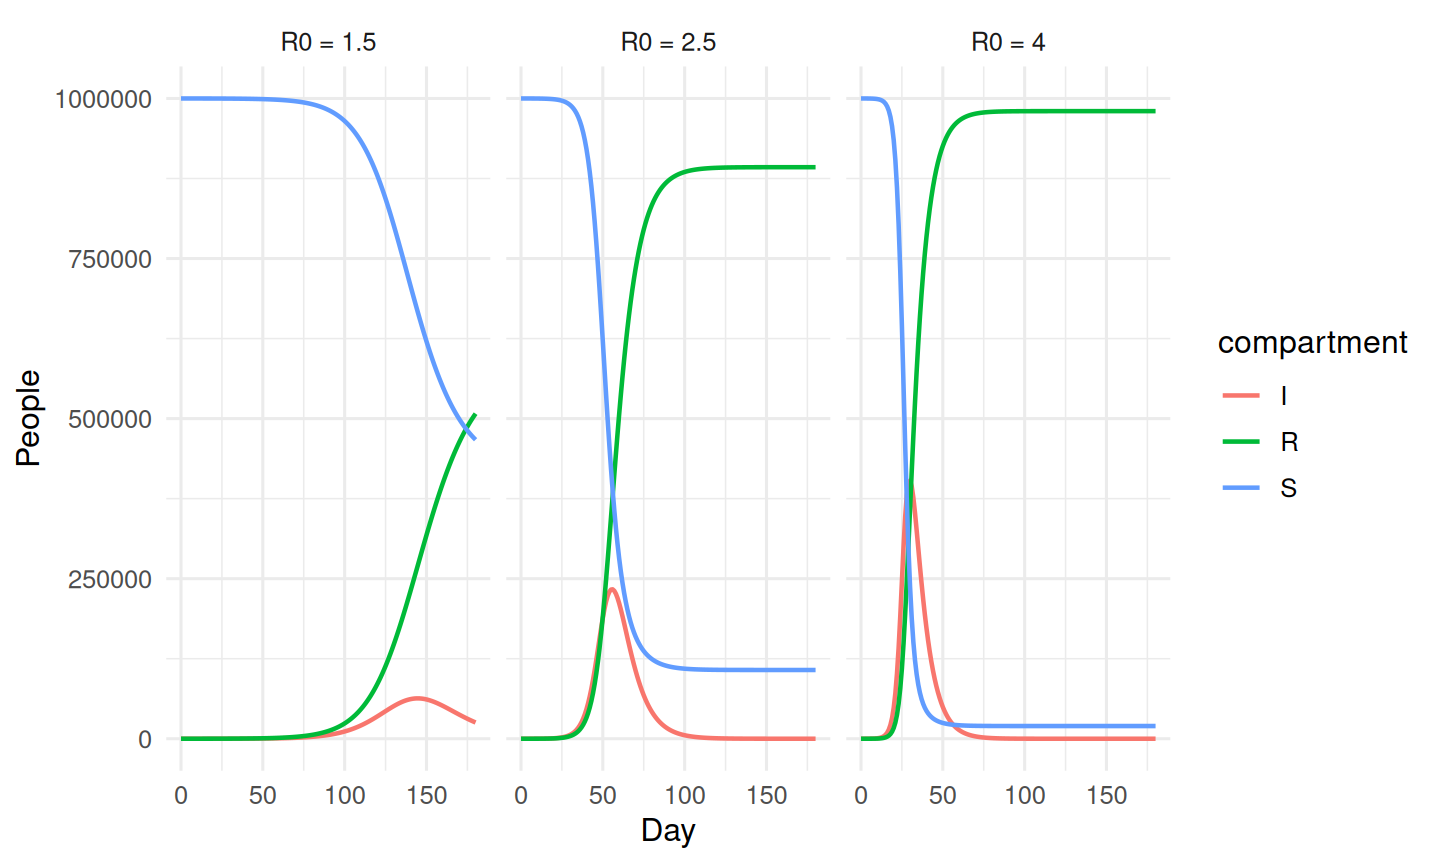
trajectories <- bind_rows(
run_sir(1.5), run_sir(2.5), run_sir(4.0)
) |>
pivot_longer(c(S, I, R), names_to = "compartment", values_to = "n")Peak prevalence and attack rate should rise with R₀.
An SIR compartmental model was simulated for a population of one million with a 7-day mean infectious period across three basic reproduction numbers (R₀ = 1.5, 2.5, 4). Peak prevalence and the final attack rate increased sharply with R₀, illustrating how small changes in transmission translate into large changes in epidemic size. Calibrated analogues of this model underpin much real-world outbreak forecasting.
R version 4.4.1 (2024-06-14)
Platform: x86_64-pc-linux-gnu
Running under: Ubuntu 24.04.4 LTS
Matrix products: default
BLAS: /usr/lib/x86_64-linux-gnu/openblas-pthread/libblas.so.3
LAPACK: /usr/lib/x86_64-linux-gnu/openblas-pthread/libopenblasp-r0.3.26.so; LAPACK version 3.12.0
locale:
[1] LC_CTYPE=C.UTF-8 LC_NUMERIC=C LC_TIME=C.UTF-8
[4] LC_COLLATE=C.UTF-8 LC_MONETARY=C.UTF-8 LC_MESSAGES=C.UTF-8
[7] LC_PAPER=C.UTF-8 LC_NAME=C LC_ADDRESS=C
[10] LC_TELEPHONE=C LC_MEASUREMENT=C.UTF-8 LC_IDENTIFICATION=C
time zone: UTC
tzcode source: system (glibc)
attached base packages:
[1] stats graphics grDevices utils datasets methods base
other attached packages:
[1] deSolve_1.42 lubridate_1.9.5 forcats_1.0.1 stringr_1.6.0
[5] dplyr_1.2.1 purrr_1.2.2 readr_2.2.0 tidyr_1.3.2
[9] tibble_3.3.1 ggplot2_4.0.3 tidyverse_2.0.0
loaded via a namespace (and not attached):
[1] gtable_0.3.6 jsonlite_2.0.0 compiler_4.4.1 tidyselect_1.2.1
[5] scales_1.4.0 yaml_2.3.12 fastmap_1.2.0 R6_2.6.1
[9] labeling_0.4.3 generics_0.1.4 knitr_1.51 htmlwidgets_1.6.4
[13] pillar_1.11.1 RColorBrewer_1.1-3 tzdb_0.5.0 rlang_1.2.0
[17] stringi_1.8.7 xfun_0.57 S7_0.2.2 otel_0.2.0
[21] timechange_0.4.0 cli_3.6.6 withr_3.0.2 magrittr_2.0.5
[25] digest_0.6.39 grid_4.4.1 hms_1.1.4 lifecycle_1.0.5
[29] vctrs_0.7.3 evaluate_1.0.5 glue_1.8.1 farver_2.1.2
[33] rmarkdown_2.31 tools_4.4.1 pkgconfig_2.0.3 htmltools_0.5.9