Plot an image
Usage
at_plot_image(
  img,
  level = NULL,
  bands = NULL,
  rgb = NULL,
  max_dim = 1024L,
  call = rlang::caller_env()
)
Arguments
- img
An annot_image.
- level
Pyramid level to sample; chosen automatically when
NULL. Plot axes always use level-0 image coordinates, scaled independently by actual width and height ratios.- bands
Optional band index for single-band display.
- rgb
Optional length-3 vector of band indices, or wavelengths in nm for a spectral cube, for a false-colour composite. Each channel of an
rgbcomposite is contrast-stretched on its own; the default natural-colour display of an image with three or more bands shows an 8-bit image with its stored values and stretches deeper data in its first three bands jointly, preserving their colour balance.- max_dim
Maximum display dimension (auto-downsampled). Default
1024. Each displayed cell covers its full source block; final partial blocks end at the image boundary. WhenlevelisNULL, the finest pyramid level that fits withinmax_dimis sampled.- call
The calling environment, for error reporting.
Value
A ggplot2::ggplot object. Non-finite samples are drawn transparent.
See also
Other plots:
at_plot(),
at_plot_mask(),
at_plot_overlay(),
at_plot_project(),
at_plot_spectrum(),
at_plot_summary()
Examples
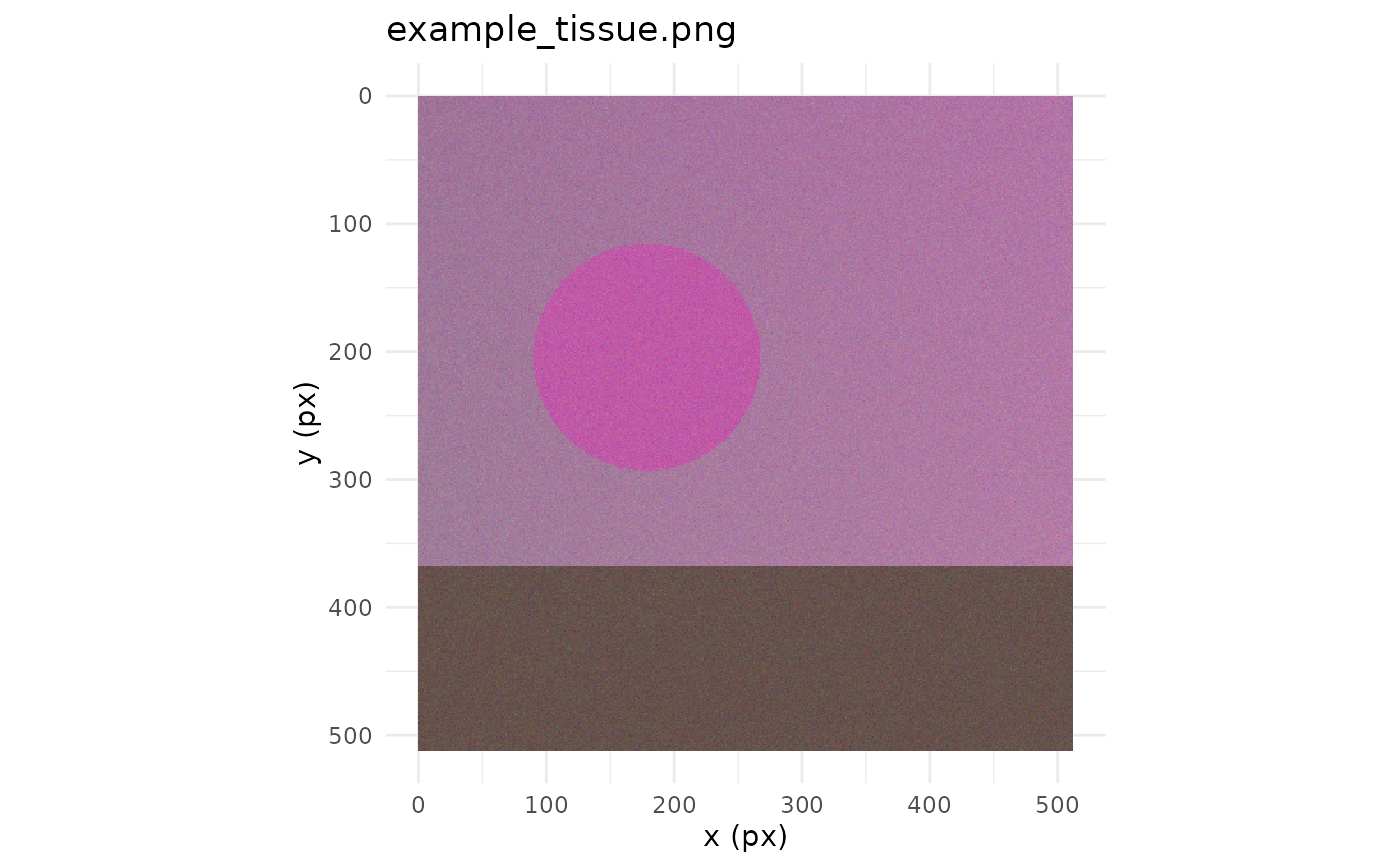
at_plot_image(at_example_image("tissue"))