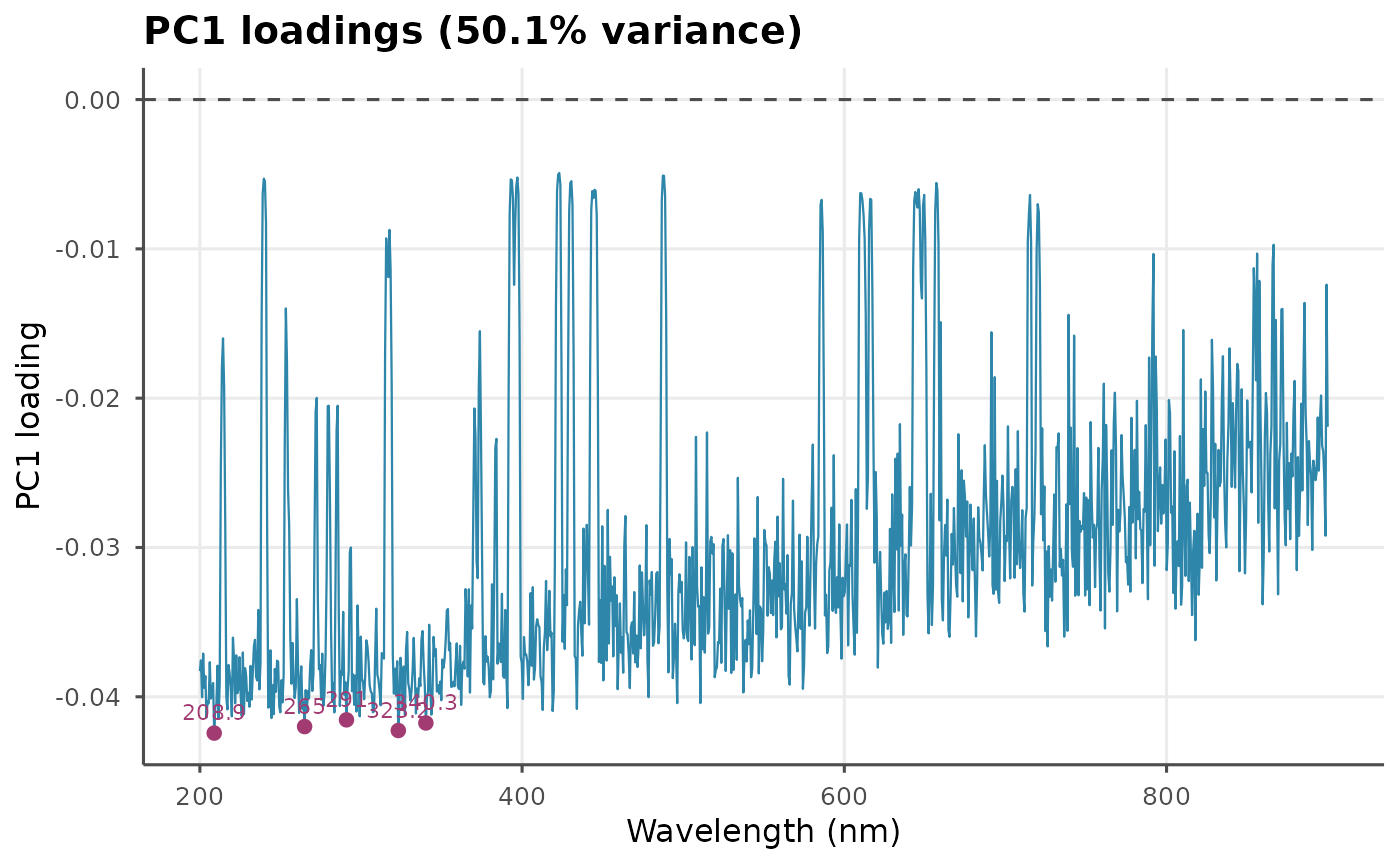
Plots the loadings for a selected principal component across the full wavelength axis, optionally annotating the top contributing channels.
Examples
ds <- ls_example_data("tissue")
pca <- ls_pca(ds, n_components = 4)
ls_plot_loadings(pca, pc = 1, n_top = 5)