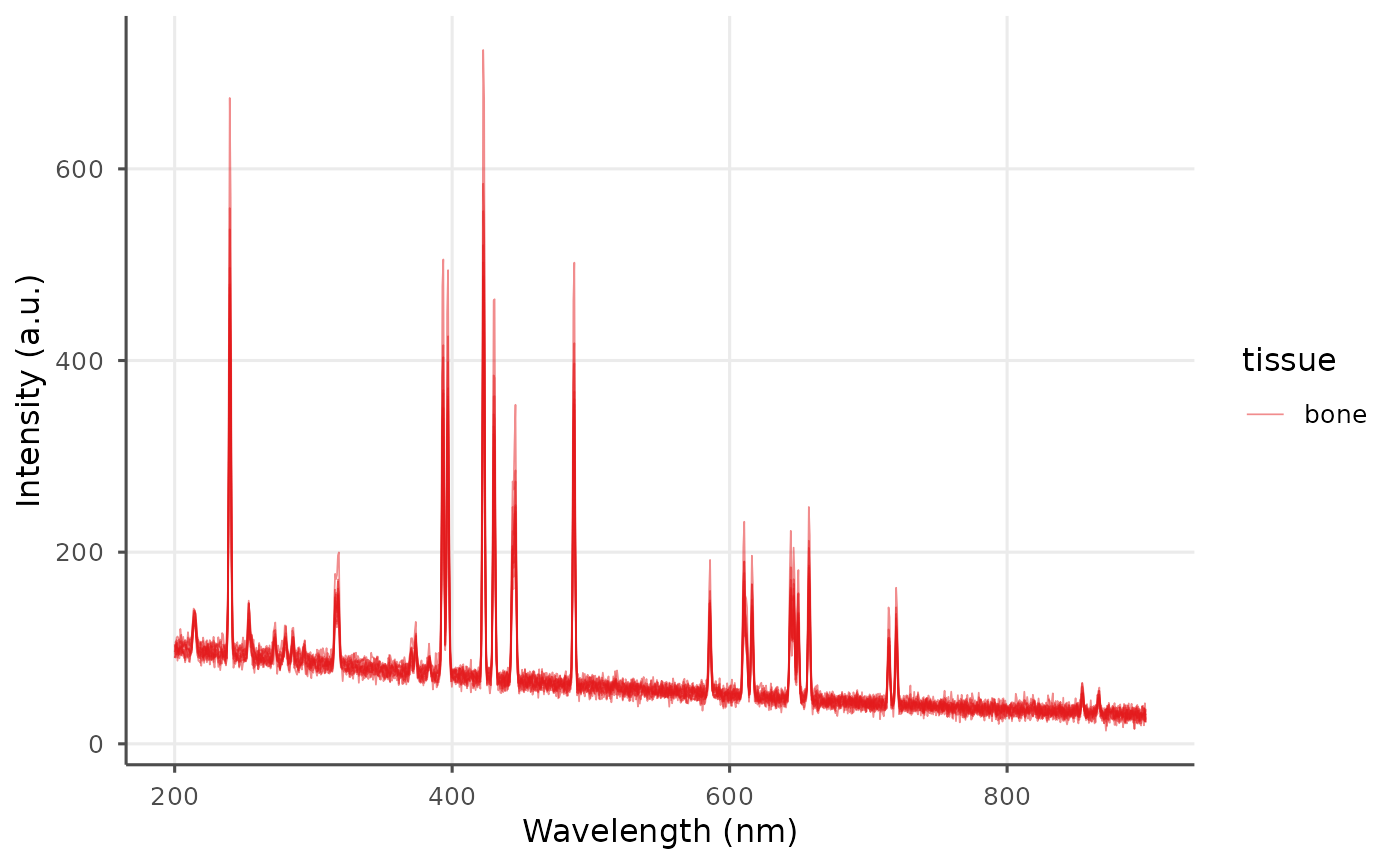
Plots multiple spectra on the same axes, optionally colored by a grouping variable.
Arguments
- dataset
A
ls_dataset()object.- color_by
Character. Column in
sample_infofor color mapping. DefaultNULL.- normalize
Logical. Normalize each spectrum to
[0, 1]. DefaultFALSE.- alpha
Numeric. Line alpha. Default 0.5.
Examples
ds <- ls_example_data("tissue")
ls_plot_overlay(ds[1:10], color_by = "tissue")