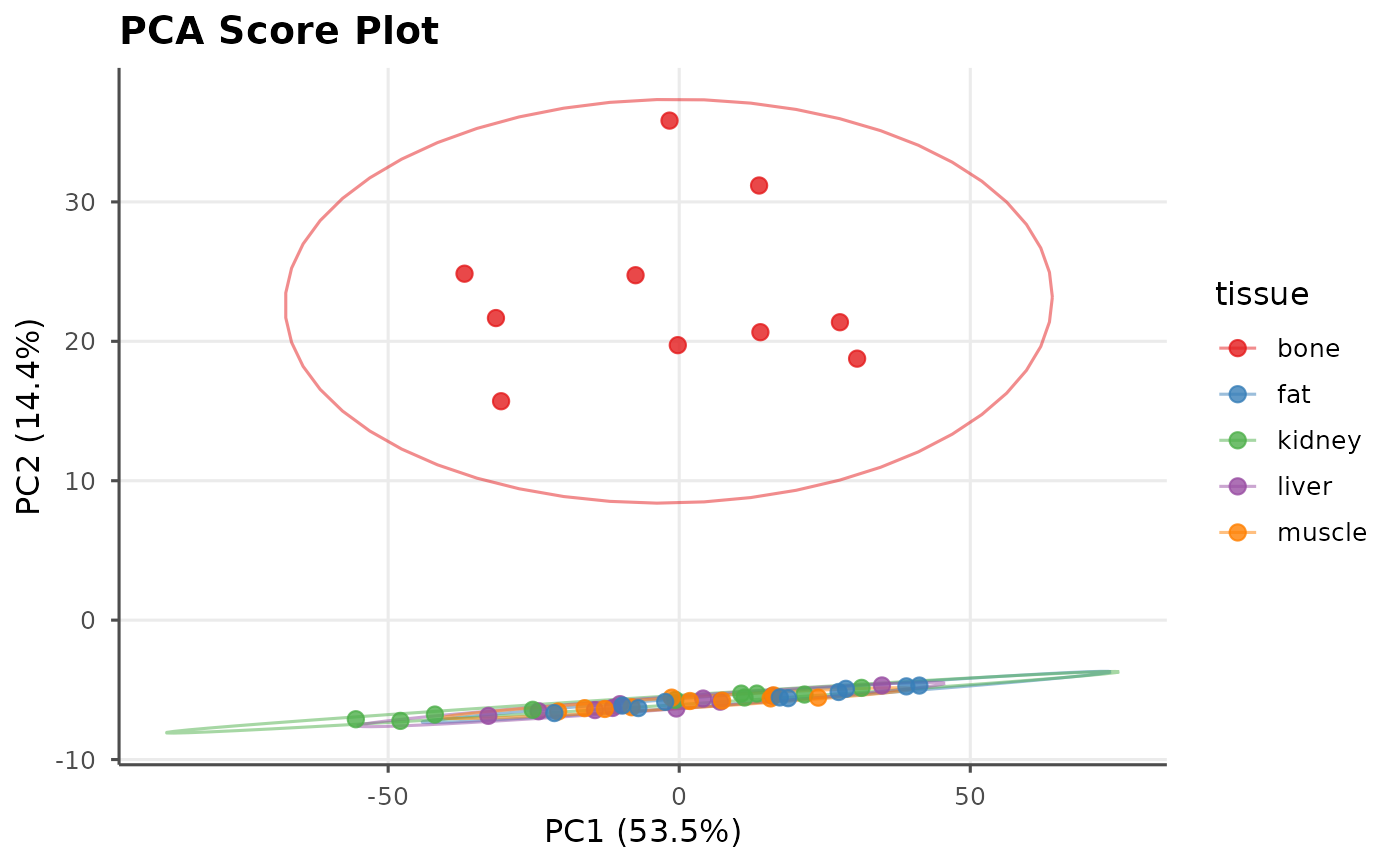
Plot PCA Scores
Arguments
- pca
A
libs_pcaobject fromls_pca().- pc_x
Integer. PC for x-axis. Default 1.
- pc_y
Integer. PC for y-axis. Default 2.
- color_by
Character. Grouping variable. Default
NULL.- ellipses
Logical. Draw 95% confidence ellipses per group. Default
TRUE.
Examples
ds <- ls_example_data("tissue")
pca <- ls_pca(ds, n_components = 4)
ls_plot_pca(pca, color_by = "tissue")