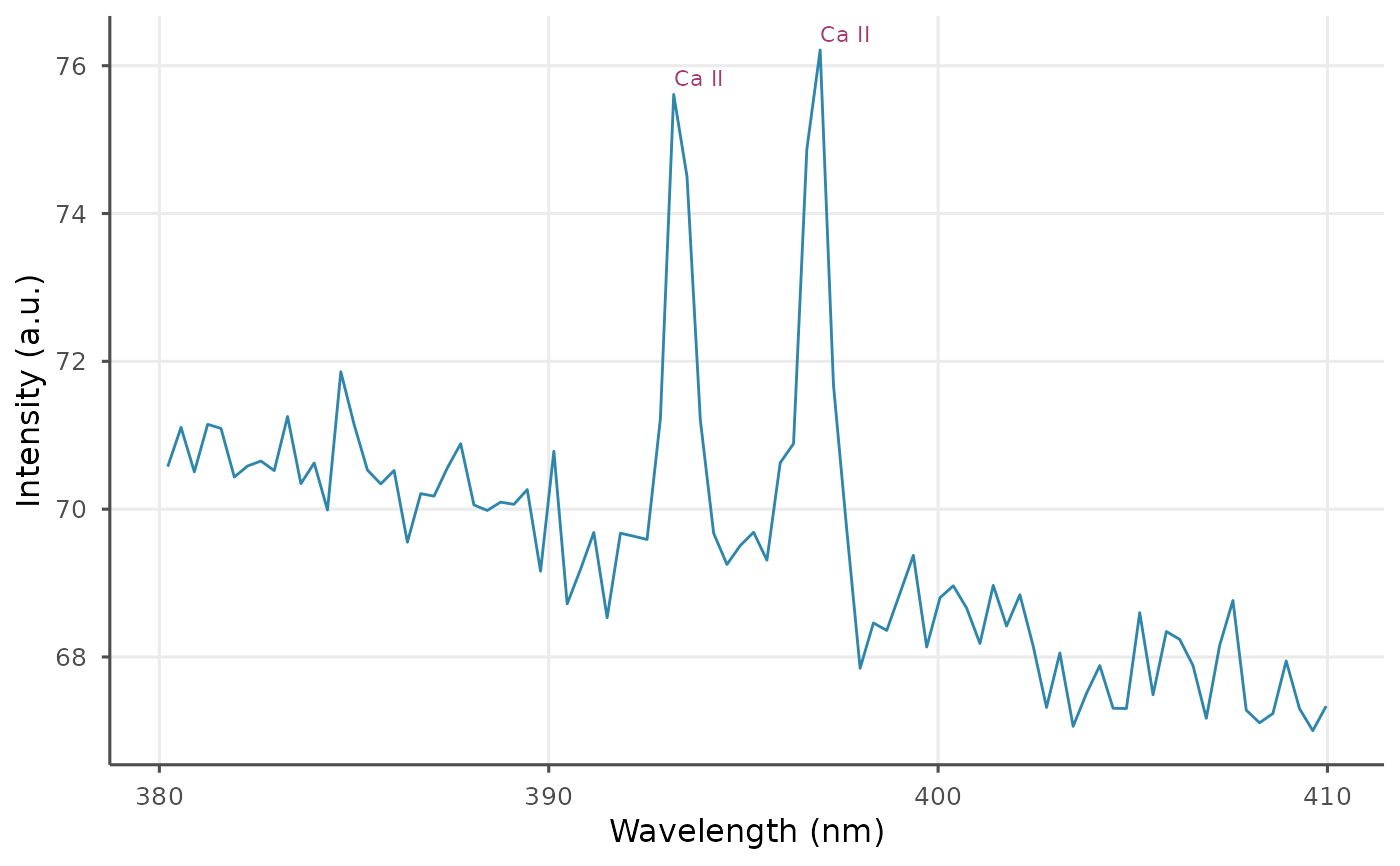
Zooms into a specified wavelength range and annotates peaks.
Arguments
- x
A
ls_spectrum()orls_dataset()object.- min_nm
Numeric. Minimum wavelength (nm).
- max_nm
Numeric. Maximum wavelength (nm).
- elements
Optional character vector. Element symbols to annotate. Default
NULL(auto-detect top peaks).- snr_threshold
Numeric. SNR threshold for peak detection. Default 5.
Examples
spec <- ls_simulate_spectrum(seed = 1)
ls_plot_region(spec, 380, 410)