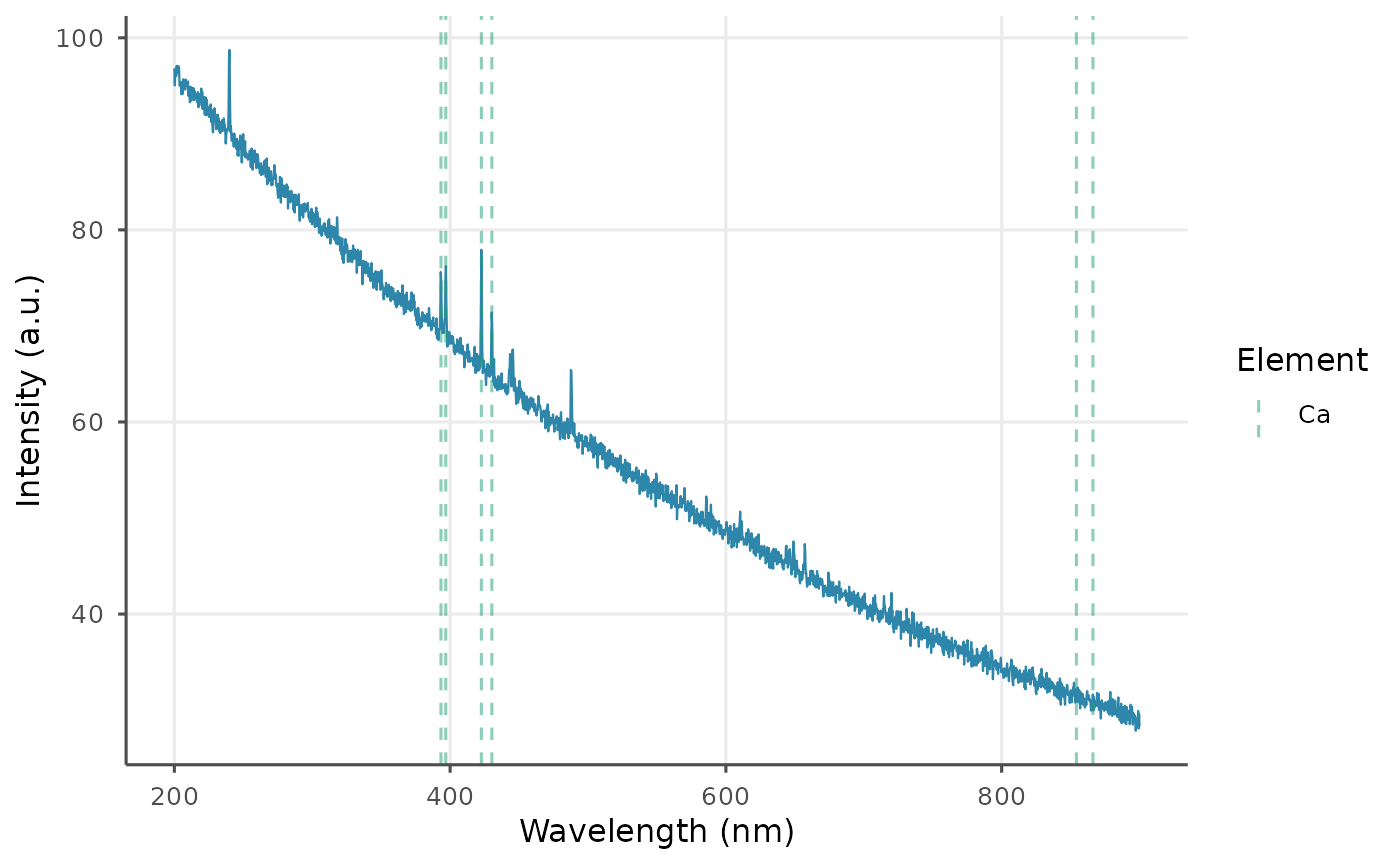
Generic spectrum plotter. Returns a ggplot2 object.
Usage
ls_plot_spectrum(
  x,
  show_peaks = FALSE,
  show_elements = NULL,
  normalize = FALSE,
  snr_threshold = 5,
  ...
)
Arguments
- x
A
ls_spectrum()object.- show_peaks
Logical. Annotate detected peaks. Default
FALSE.- show_elements
Character vector of element symbols to highlight as dashed vertical lines with labels. Default
NULL.- normalize
Logical. Normalize intensity to
[0, 1]before plotting. DefaultFALSE.- snr_threshold
Numeric. SNR threshold for peak annotation when
show_peaks = TRUE. Default 5.- ...
Additional arguments (currently unused).
Examples
spec <- ls_simulate_spectrum(seed = 1)
ls_plot_spectrum(spec, show_elements = "Ca")