Inspect a structure-map result
Arguments
- object, x
An
mssr_result.- ...
Further arguments. For plotting, passed to
graphics::image().
Value
summary() returns a named list of class summary.mssr_result with
role, dimensions, grid, range, diagnostics, parameters and version
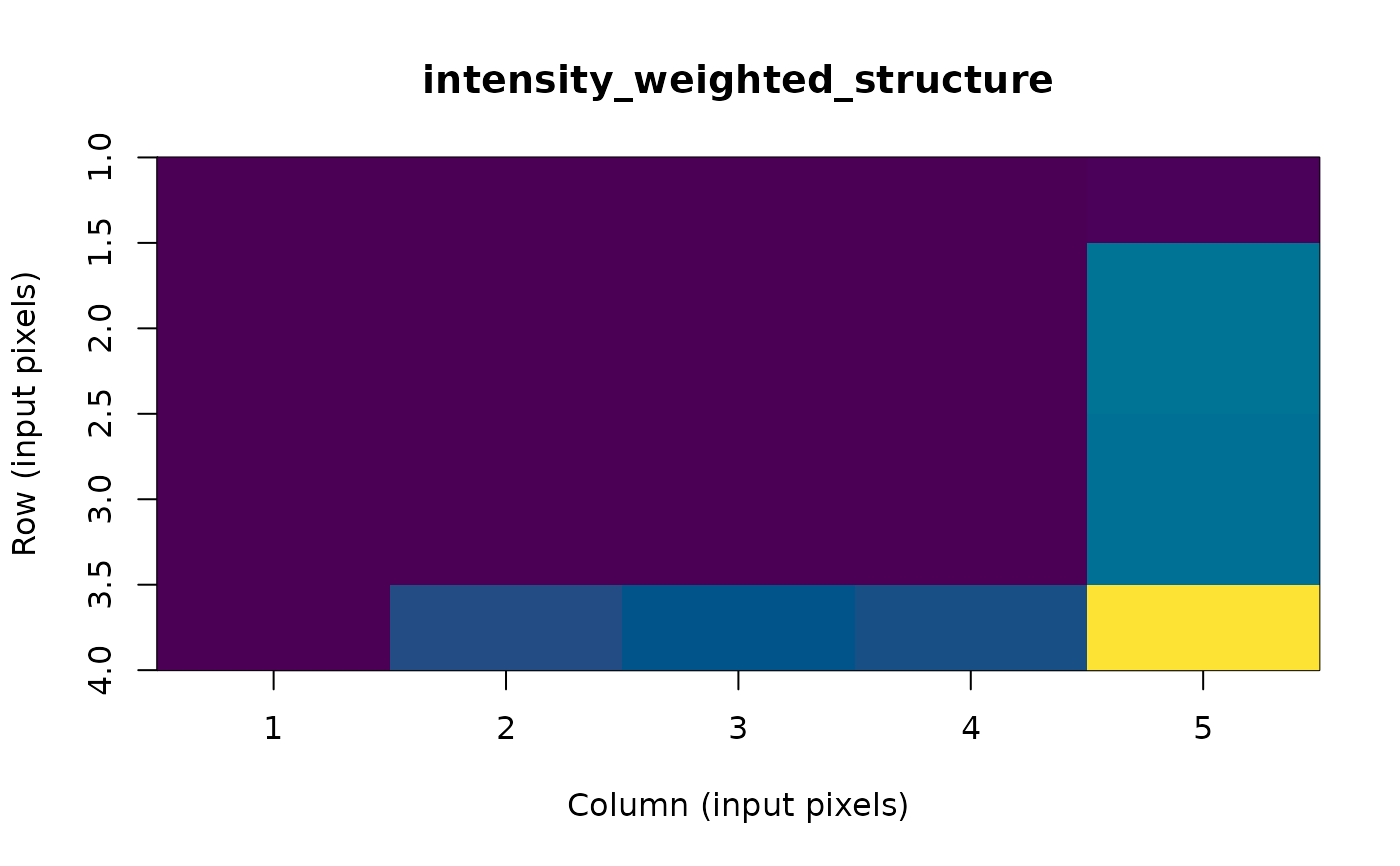
identities; it prints as a short report. plot() draws the stored
map in input-pixel coordinates and invisibly returns the result. It does
not transform the stored values or infer physical sampling.
Examples
r <- mssr(matrix(1:20, 4, 5), fwhm = 2)
summary(r)
#> MSSR result summary: intensity_weighted_structure
#>   Grid:        input 4 x 5 -> output 4 x 5 (amp 1, extent grid)
#>   Parameters:  fwhm 2 px, order 1, kernel disk (half-size 1), rounding half_even
#>                intensity weighting TRUE, mesh FALSE
#>   Values:      range 0 to 20; zero fraction 0.650; negative fraction 0.000
#>   Diagnostics: defined; 0 undefined order step(s) skipped; 4 offsets
#>   Engine:      mssr_r_rev3, mssrscopR 0.2.0; result schema 1.0.0; evidence numerical_tool_only
#>   Not a quantitative intensity: measure on the original data.
plot(r)