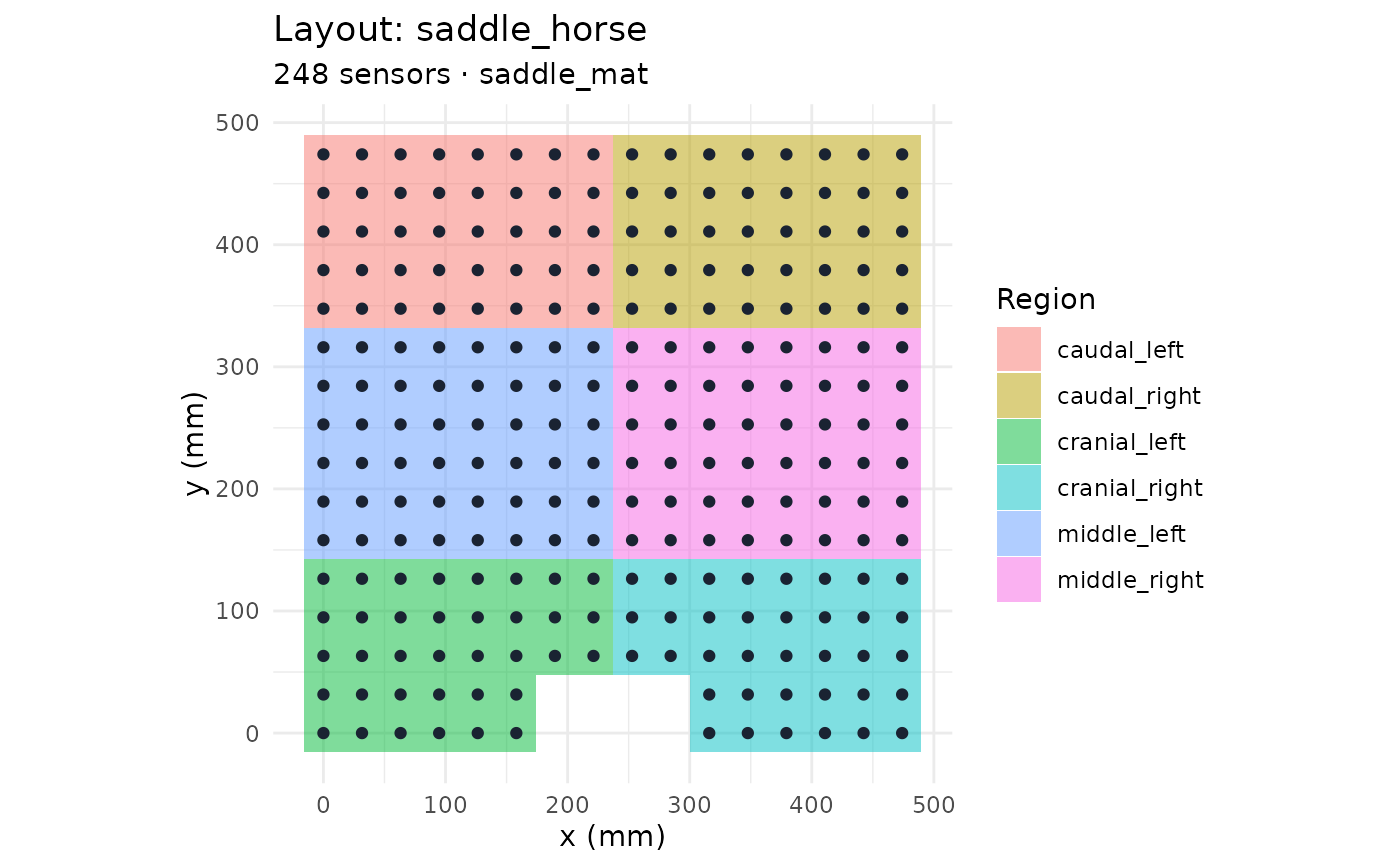
Visualizes a pr_layout showing active sensor positions and colored region masks (if any).
Usage
# S3 method for class 'pr_layout'
plot(x, show_regions = TRUE, show_ids = FALSE, ...)
Arguments
- x
A pr_layout object.
- show_regions
Logical. If
TRUE(default), draws region masks in colors. IfFALSE, shows only sensor positions.- show_ids
Logical. If
TRUE, labels each sensor with its id. DefaultFALSE.- ...
Not used.
Examples
plot(pr_layout_saddle("horse"))