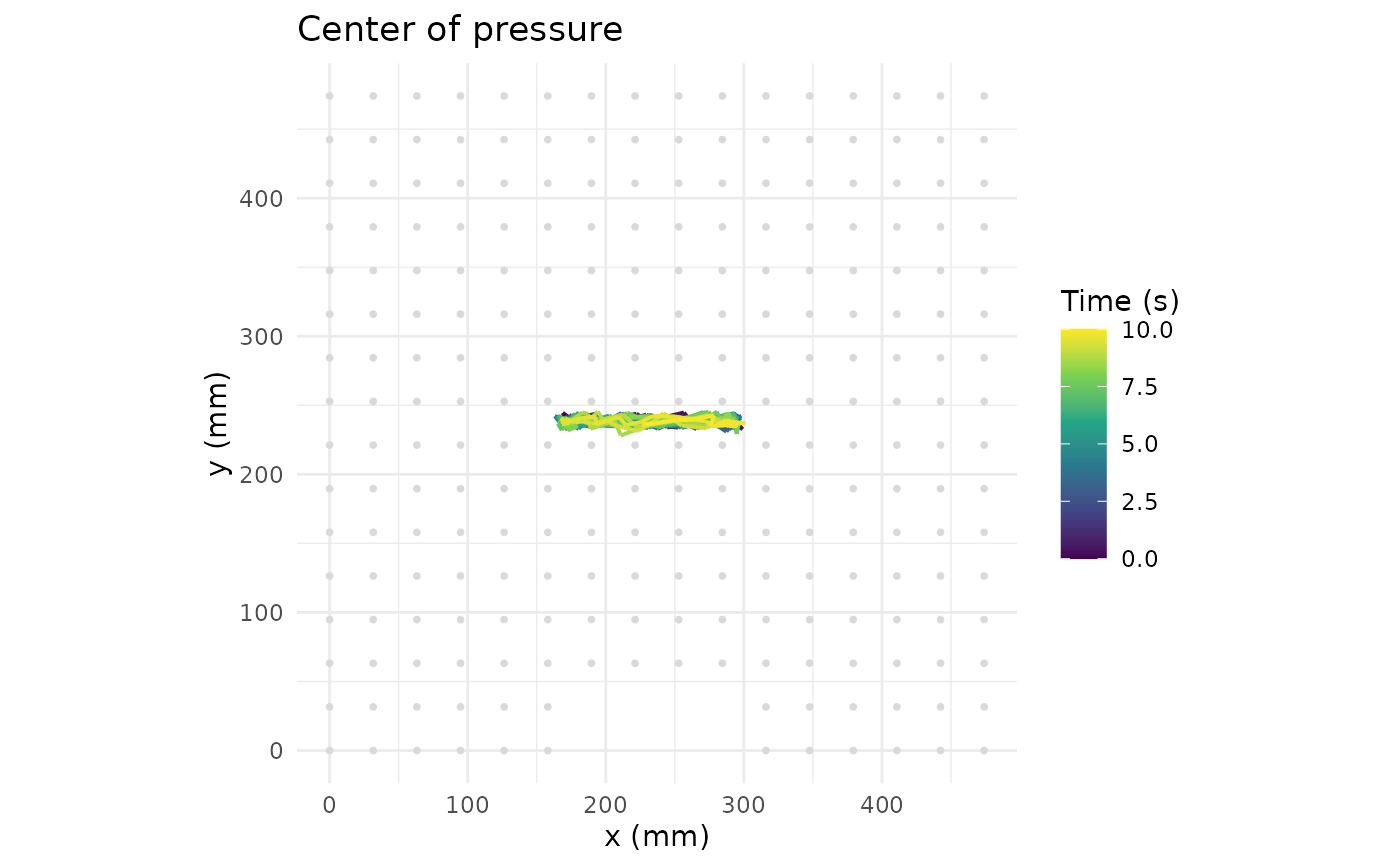
Plot Center of Pressure Trajectory
Usage
pr_plot_cop(trial, show_layout = TRUE, color_by = c("time", "velocity"))Arguments
- trial
A pr_trial object.
- show_layout
Logical. Draw sensor grid in background. Default
TRUE.- color_by
Character.
"time"(default) or"velocity".
Examples
pr_plot_cop(pr_example_trial("saddle_horse"))