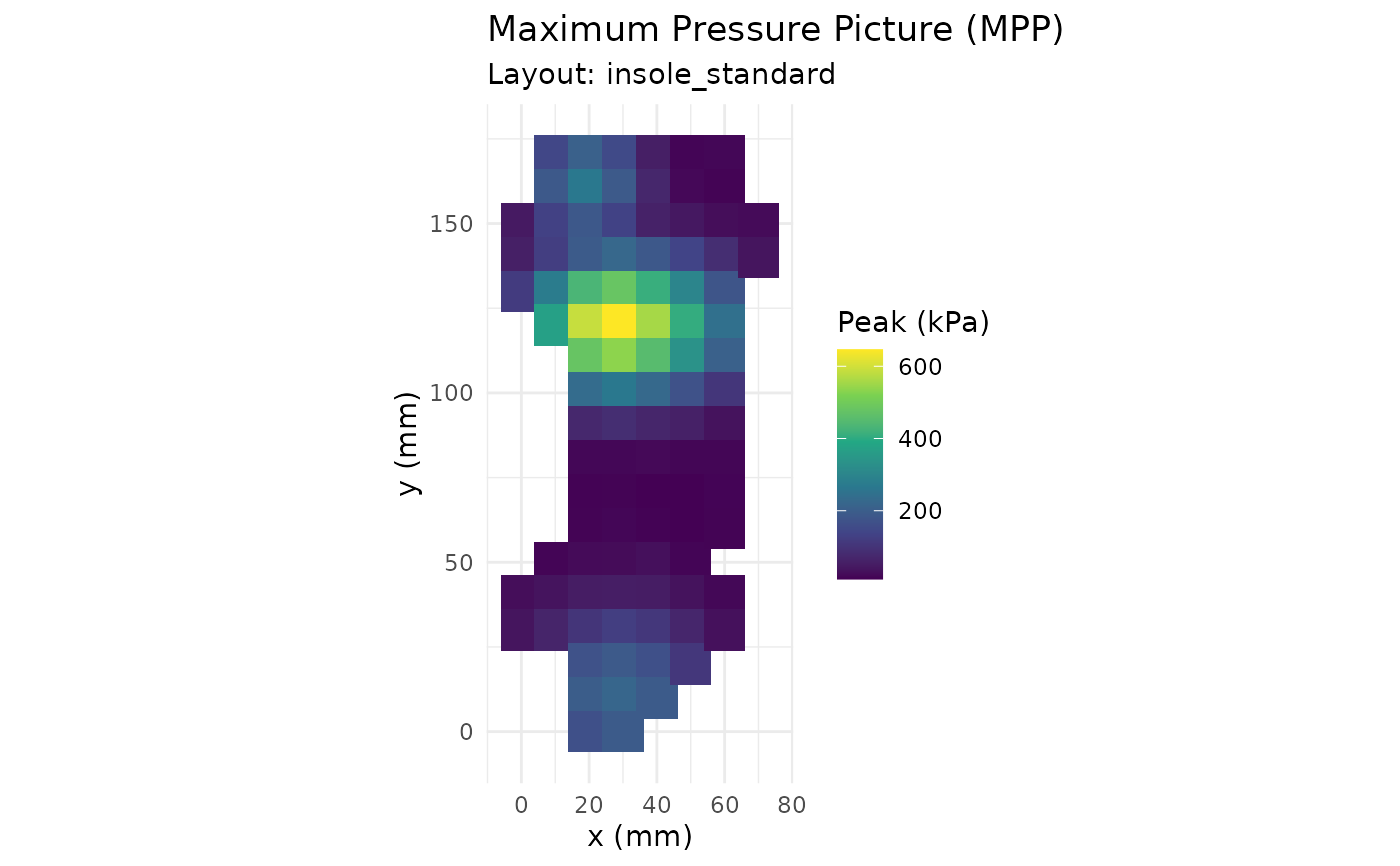
Displays a 2D heatmap for a single frame or a summary image (MPP, MVP, PTI, contact frequency).
Usage
pr_plot_heatmap(
  trial,
  frame = NULL,
  type = c("mpp", "mvp", "pti", "contact"),
  show_regions = FALSE,
  palette = "viridis",
  range = NULL,
  interpolate = FALSE,
  title = NULL
)
Arguments
- trial
A pr_trial object.
- frame
Integer. Frame number to display. If
NULL(default), shows the summary picture specified bytype.- type
Character. Summary type when
frameisNULL:"mpp"(max),"mvp"(mean),"pti"(pressure-time integral),"contact"(contact frequency).- show_regions
Logical. Overlay region boundaries. Default
FALSE.- palette
Character. One of
"viridis"(default),"inferno","plasma","magma","jet","classic".- range
Numeric vector of length 2. Colour range.
NULLauto-scales.- interpolate
Logical. Reserved for spatial interpolation (currently draws the raw sensor grid). Default
FALSE.- title
Character. Plot title.
NULLauto-generates.
Examples
trial <- pr_example_trial("insole")
pr_plot_heatmap(trial)