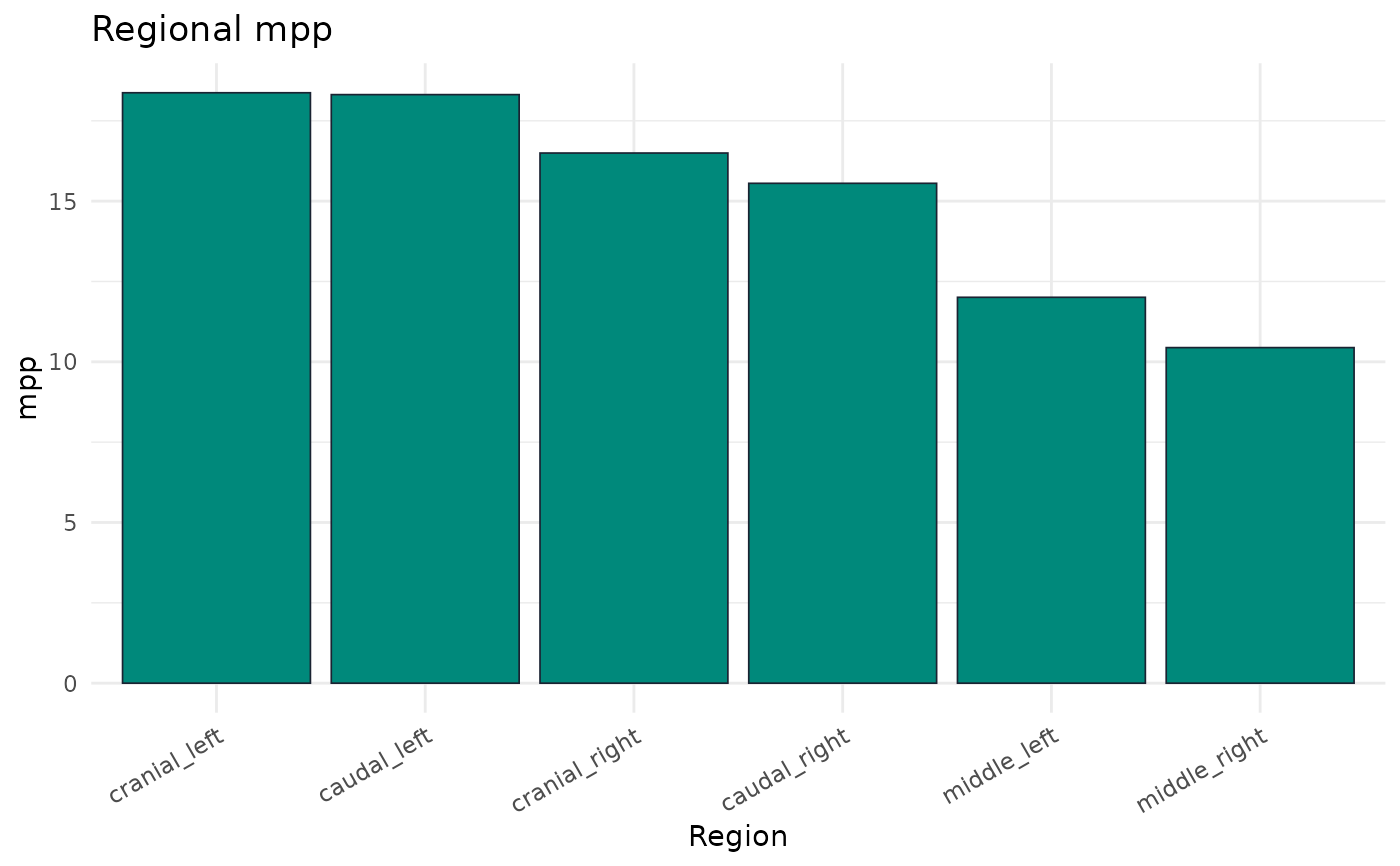
Regional Parameter Comparison Bar Chart
Arguments
- regional_data
Output of
pr_calc_regional().- parameter
Character. Parameter column to plot. Default
"mpp".- thresholds
A tibble::tibble from
pr_ref_*()functions. If non-NULL, draws horizontal threshold lines whereparametermatches.
Examples
trial <- pr_example_trial("saddle_horse")
reg <- pr_calc_regional(trial)
pr_plot_regional_bar(reg, "mpp")