Quick-look plots for a parsed qview object.
Arguments
- x
A
qviewobject returned byread_qview().- type
One of
"plate_map","intensity_heatmap","replicate_scatter". Default"plate_map".- ...
Unused; for S3 generic compatibility.
Details
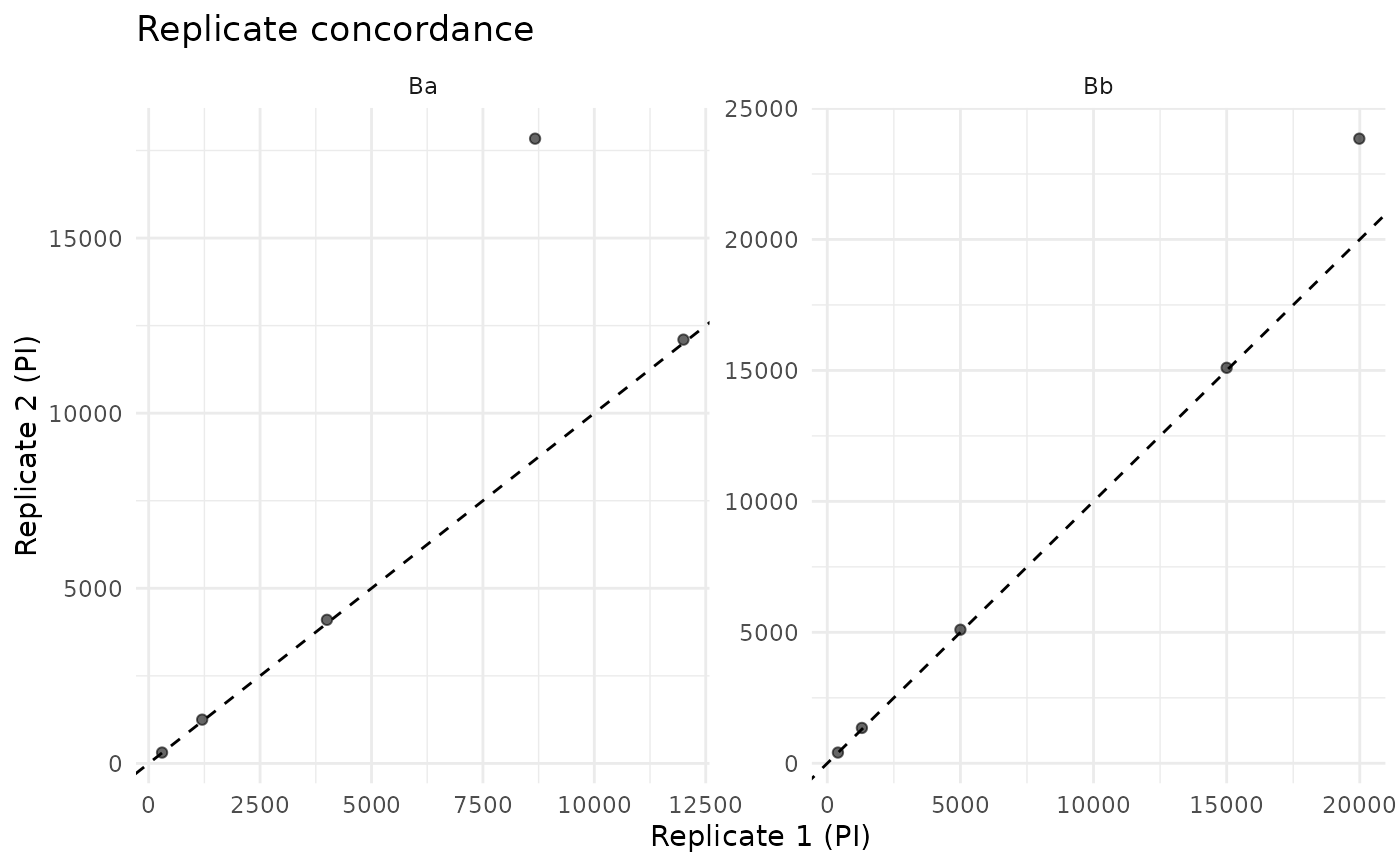
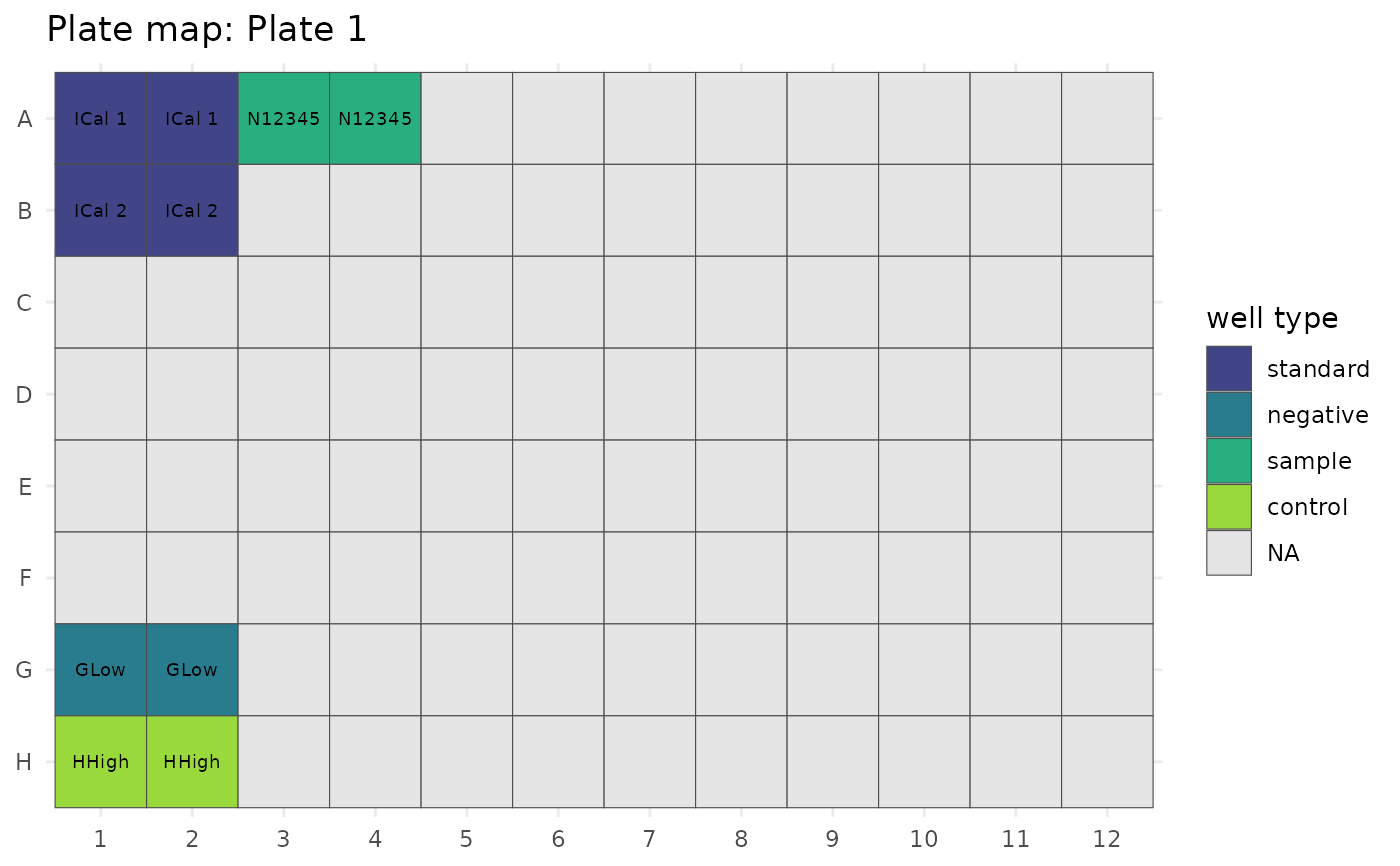
"plate_map"– heat-coloured plate map, one cell per well, fill by well type (standard / negative / sample / control)."intensity_heatmap"– per-analyte facet, fill by replicate-1 pixel intensity per well."replicate_scatter"– replicate 1 vs replicate 2 pixel intensity per analyte.
Requires the ggplot2 package (Suggested).
See also
Other qview-methods:
as_tibble.qview(),
is_qview(),
print.qview(),
summary.qview()
Examples
path <- system.file("extdata", "example.Q-View", package = "qviewparsR")
qv <- read_qview(path, verbose = FALSE)
plot(qv, type = "plate_map")

plot(qv, type = "replicate_scatter")