Plot the end-of-game distribution against the published reference
Source:R/plot.R
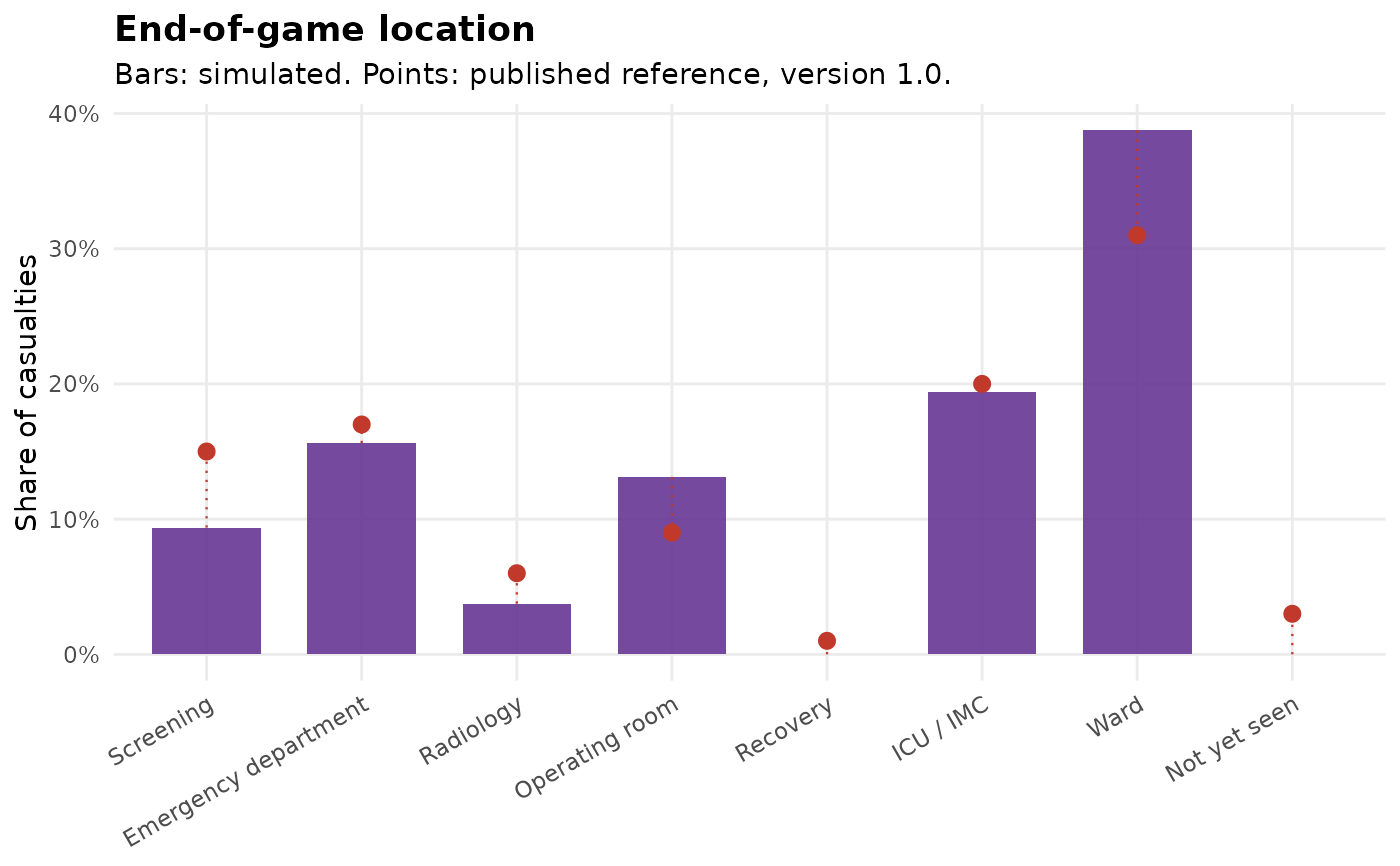
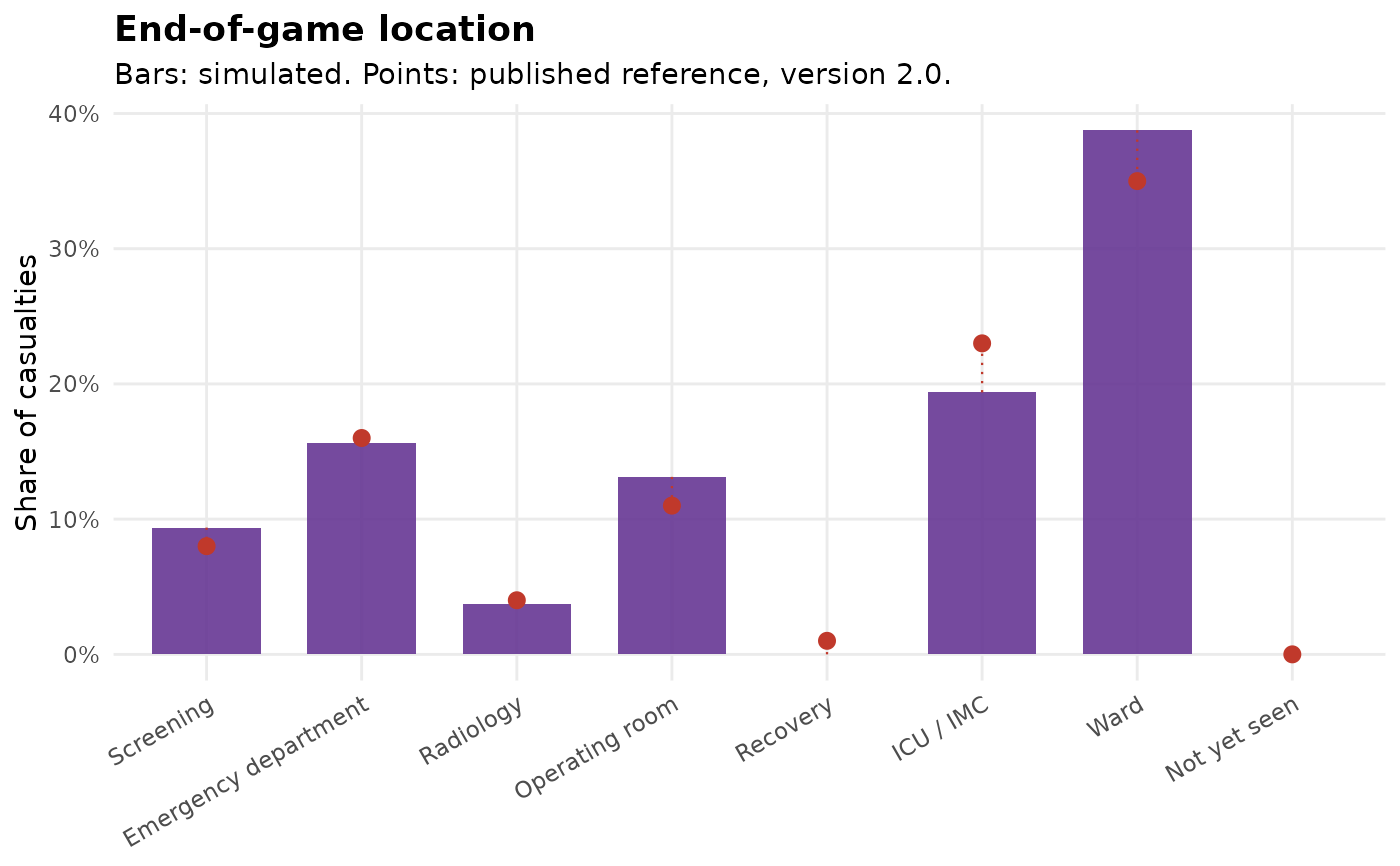
sdt_plot_end_state.RdDraws the observed proportion per reporting location as bars, with the published reference proportion overlaid as a point and the gap drawn as a segment between them. It is the honest version of a calibration claim: the gap is visible rather than asserted.
Usage
sdt_plot_end_state(run, version = c("2.0", "1.0"))Arguments
- run
A
game_runfromsdt_simulate().- version
Which evaluated version of the exercise to compare against,
"2.0"or"1.0".
See also
summary.game_run(), which produces the underlying tibble.
Examples
run <- sdt_simulate(sdt_reference_scenario(), replications = 4,
seed = 1, verbose = FALSE)
sdt_plot_end_state(run)
 sdt_plot_end_state(run, version = "1.0")