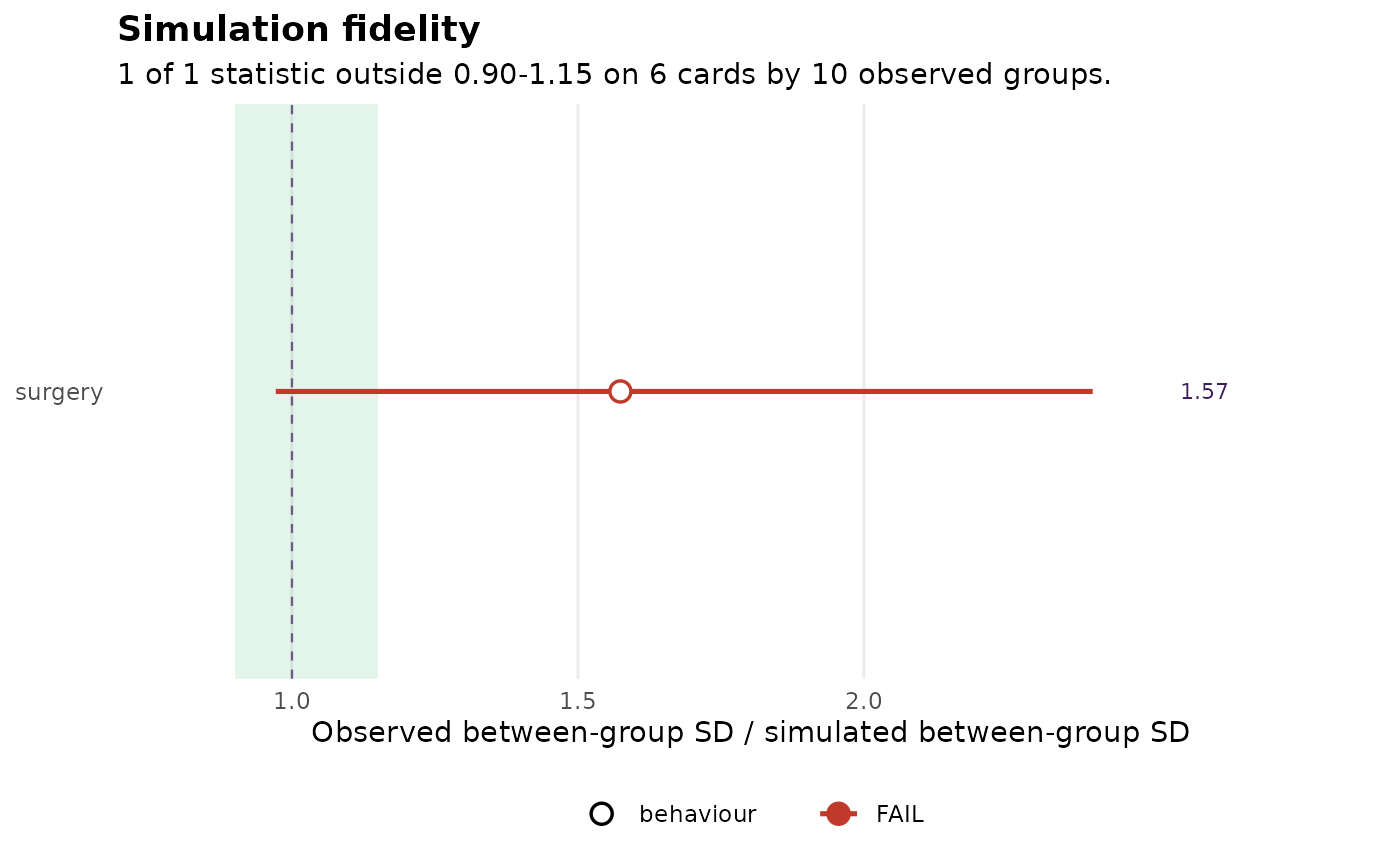
A dot-and-range chart of the dispersion ratios: one row per statistic,
the ratio on the x axis, the passing band shaded, and the bootstrap
interval drawn as a range. Controls carry their own marker because they
are read backwards from the rest – see the "Negative controls" section of
sdt_fidelity().
Arguments
- x
A fidelity table from
sdt_fidelity().
Details
A ratio of Inf, which is what a simulator that produces no between-group
spread at all earns, is drawn as an arrow pinned to the right-hand edge and
labelled, rather than being dropped from the plot or silently rescaling it.
Examples
set.seed(1)
cards <- sprintf("c%02d", 1:6)
obs <- expand.grid(group_id = sprintf("g%02d", 1:10), card = cards,
                   stringsAsFactors = FALSE)
team <- stats::setNames(stats::runif(10, 0.1, 0.9), sprintf("g%02d", 1:10))
obs$surgery <- stats::runif(nrow(obs)) < team[obs$group_id]
sim <- expand.grid(sim_group = sprintf("s%02d", 1:10), card = cards,
                   stringsAsFactors = FALSE)
sim$surgery <- stats::runif(nrow(sim)) < mean(team)
sdt_plot_fidelity(sdt_fidelity(sim, obs, n_boot = 50, seed = 1))