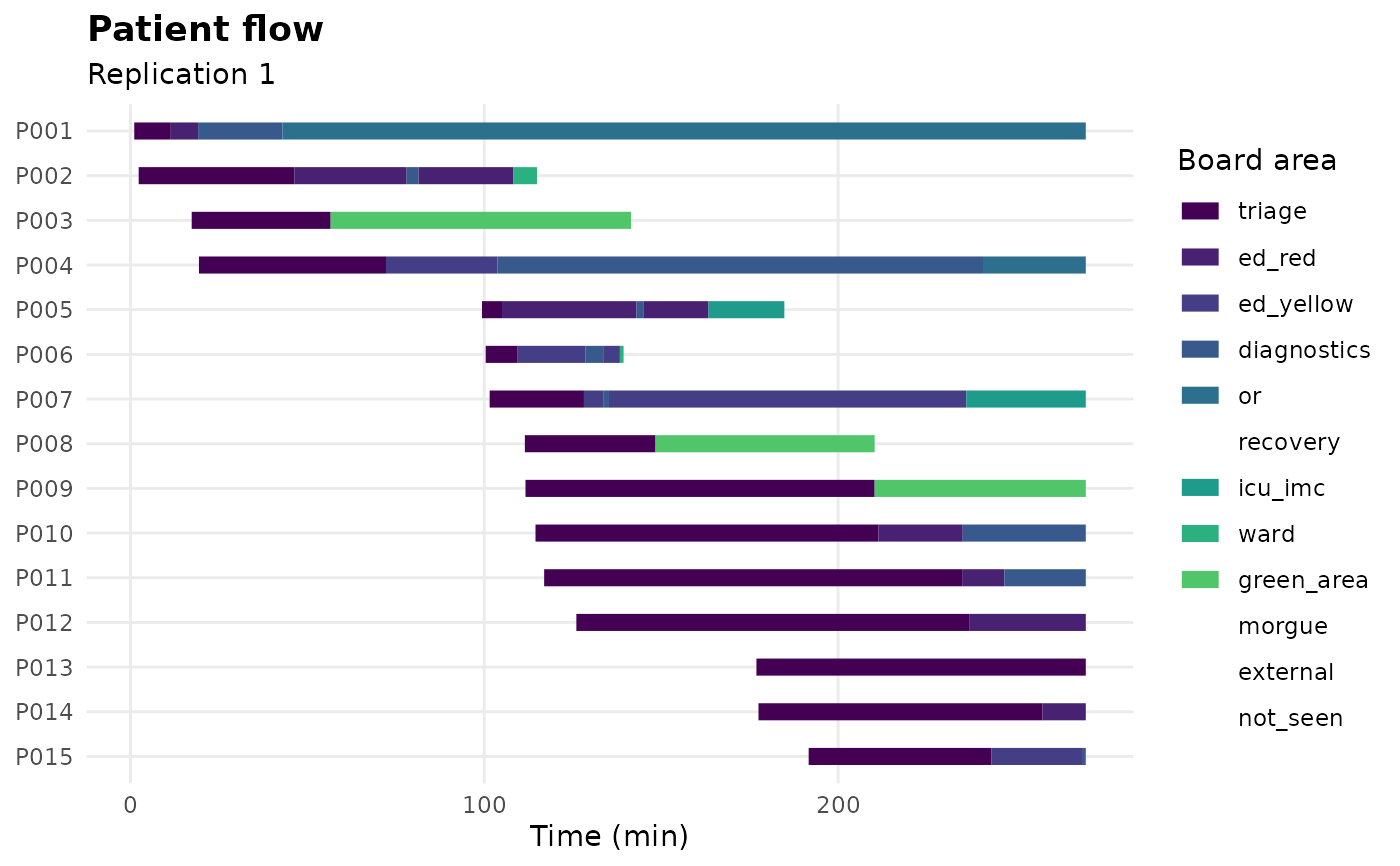
A Gantt chart of one replication: each casualty is a row, each board area a coloured bar spanning the time it was there. This is the picture of the event log, and the fastest way to see where a board is congested.
Arguments
- run
A
game_runfromsdt_simulate().- replication
Which replication to draw.
- max_casualties
Cap on the number of casualties shown, to keep the chart readable. The earliest arrivals are kept.
Examples
co <- sdt_synthetic_cohort(15, seed = 1)
run <- sdt_simulate(sdt_scenario(co), replications = 1, verbose = FALSE)
sdt_plot_flow(run)