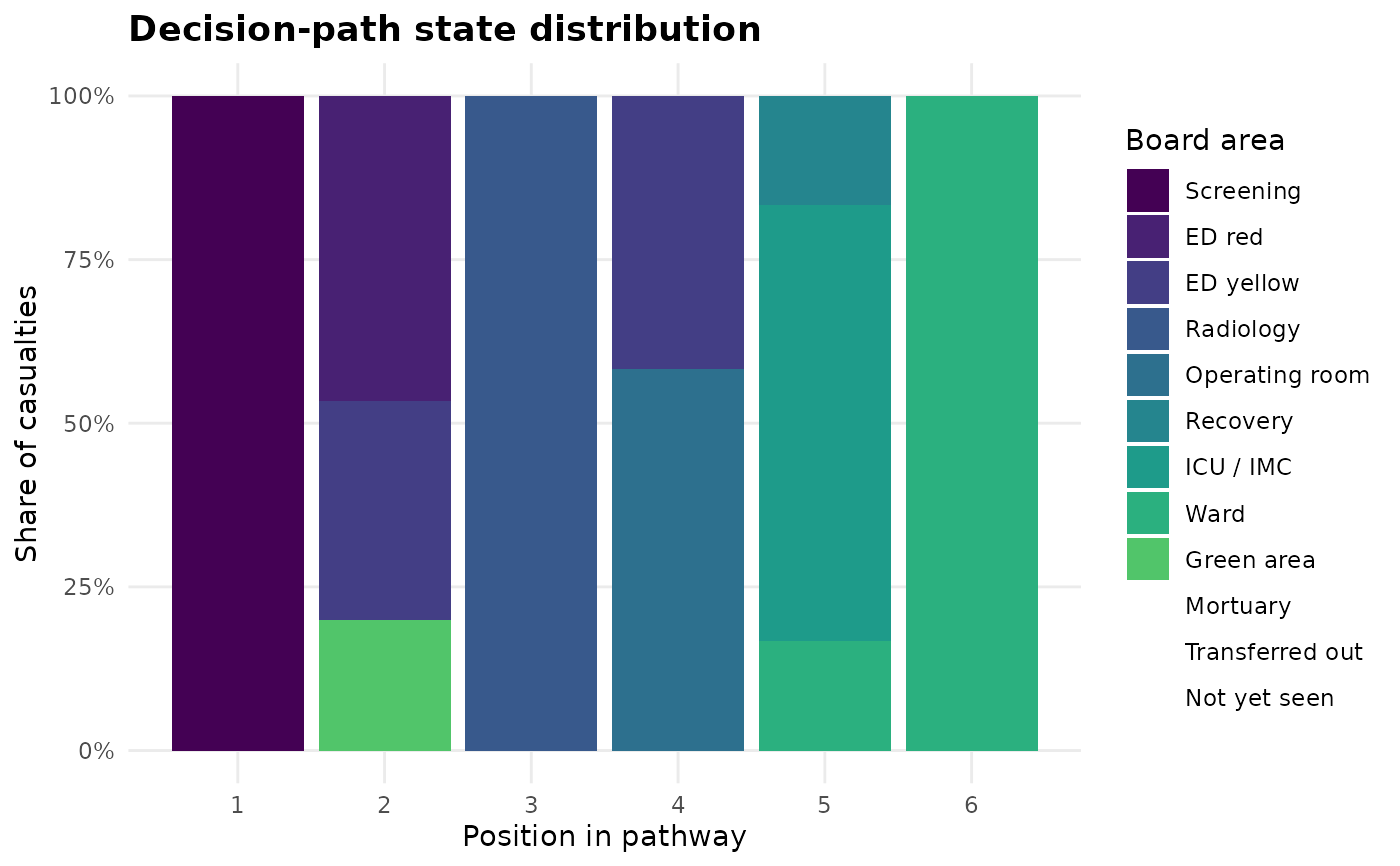
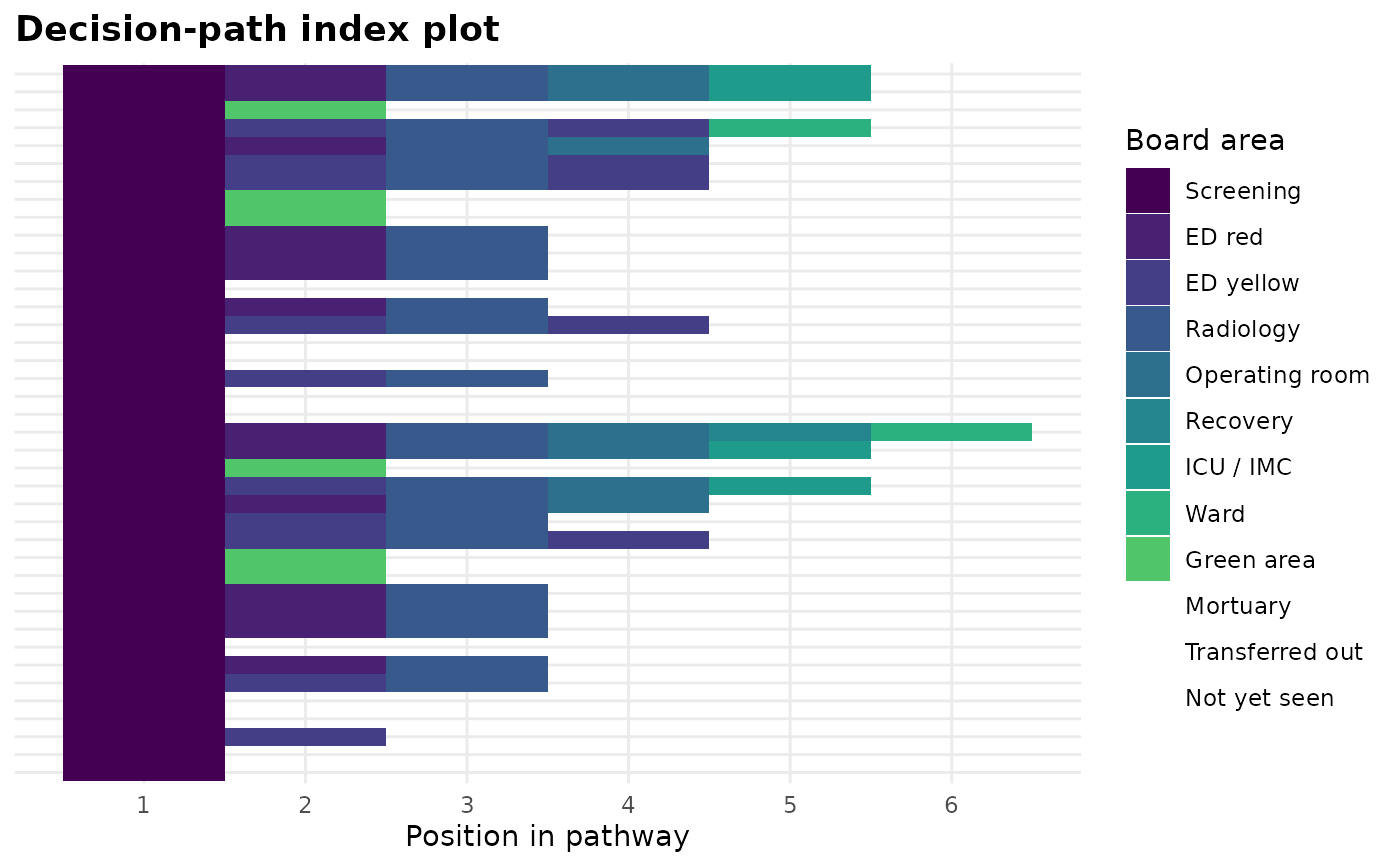
Two standard sequence-analysis views, both drawn with ggplot2 rather than TraMineR's base-graphics plotting, so they compose and theme like every other plot in the package.
Usage
sdt_plot_sequences(
  run,
  type = c("index", "distribution"),
  replication = NULL,
  clusters = NULL
)
Arguments
- run
A
game_runfromsdt_simulate().- type
"index"or"distribution".- replication
Optional replication to restrict to.
- clusters
Optional cluster assignment from
sdt_seq_cluster(). When supplied, the plot is facetted by cluster.
Details
"index" draws one row per casualty, coloured by the area occupied at each
position: the shape of individual pathways. "distribution" draws the share
of casualties in each area at each position: the shape of the cohort.
Examples
co <- sdt_synthetic_cohort(n = 20, seed = 1)
run <- sdt_simulate(sdt_scenario(co), replications = 2, seed = 1,
verbose = FALSE)
sdt_plot_sequences(run)
 sdt_plot_sequences(run, type = "distribution")