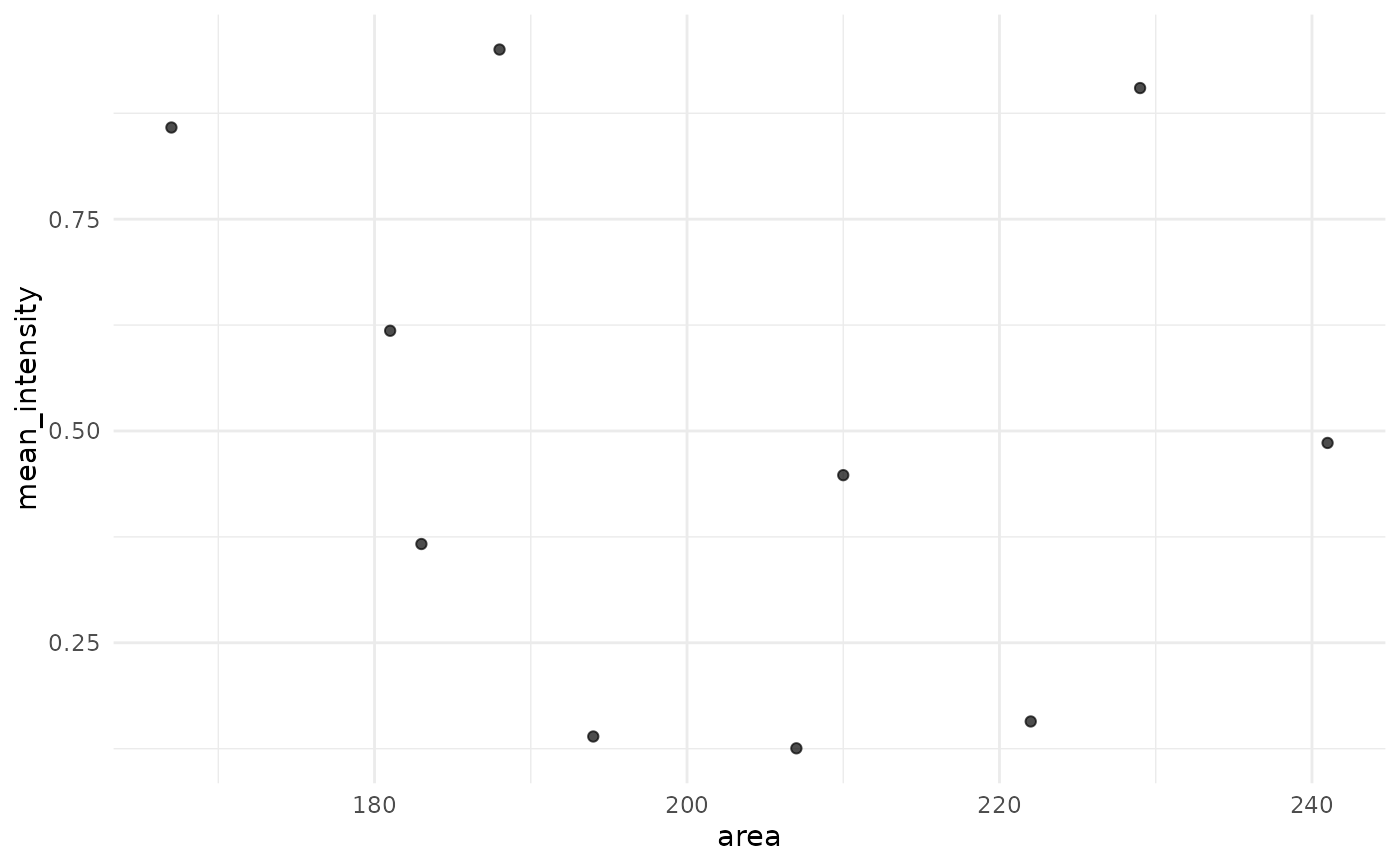
Produces a scatter plot of two numeric cell features, with optional colour and faceting variables.
Arguments
- features
A data frame of cell features (e.g., from
sg_compute_features()).- x
Character, column name for the x-axis (default
"area").- y
Character, column name for the y-axis (default
"mean_intensity").- color
Character column name for point colour, or
NULL.- facet
Character column name for faceting, or
NULL.
Examples
feat <- data.frame(
  cell_id = 1:10,
  area = rpois(10, 200),
  mean_intensity = runif(10)
)
p <- sg_plot_features(feat, x = "area", y = "mean_intensity")
p