Displays a bar chart of segmentation evaluation metrics such as IoU, precision, recall, and F1.
Examples
res <- data.frame(
  metric = c("IoU", "Precision", "Recall", "F1"),
  value = c(0.82, 0.90, 0.85, 0.87)
)
p <- sg_plot_metrics(res)
p
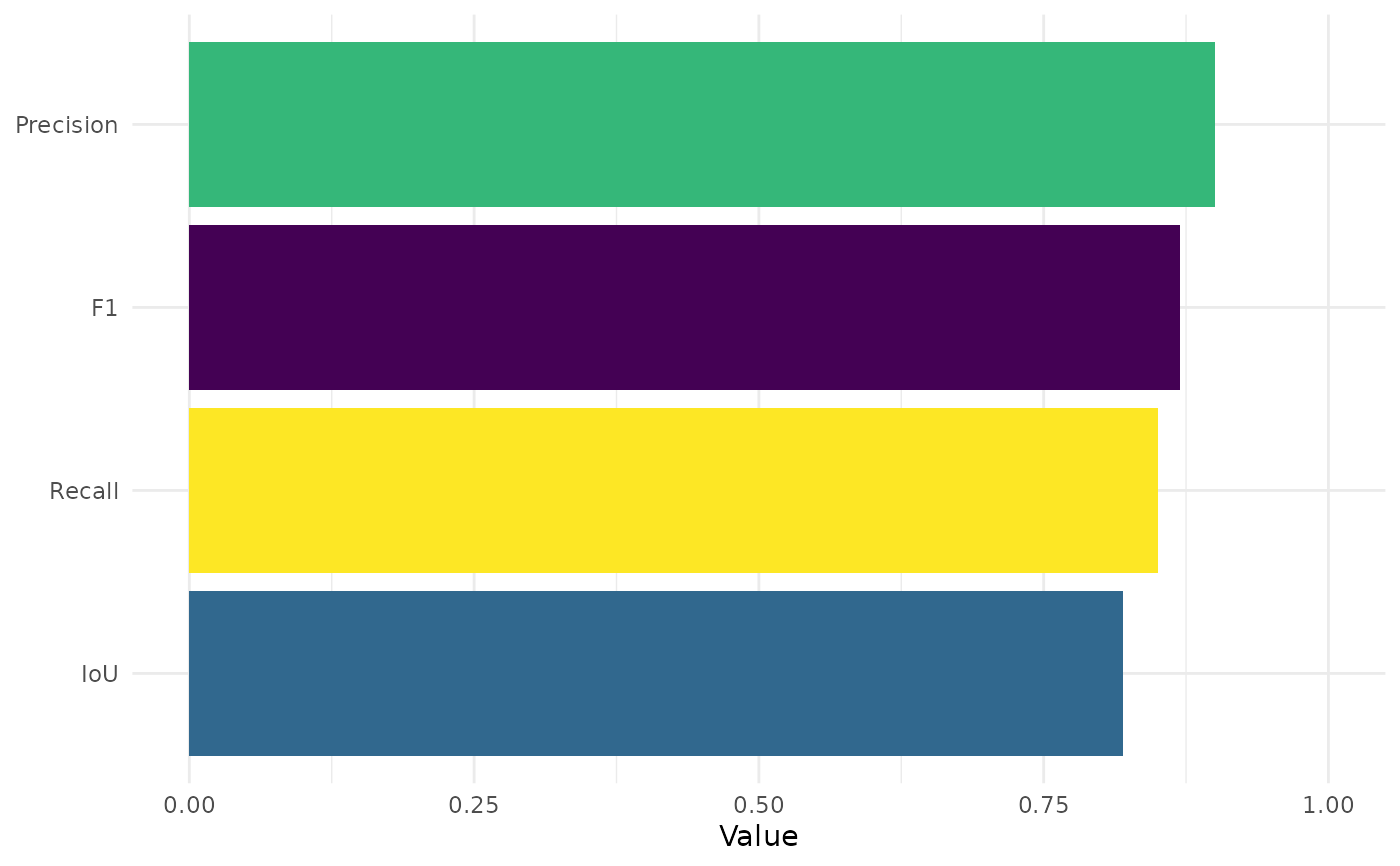
Displays a bar chart of segmentation evaluation metrics such as IoU, precision, recall, and F1.
res <- data.frame(
metric = c("IoU", "Precision", "Recall", "F1"),
value = c(0.82, 0.90, 0.85, 0.87)
)
p <- sg_plot_metrics(res)
p