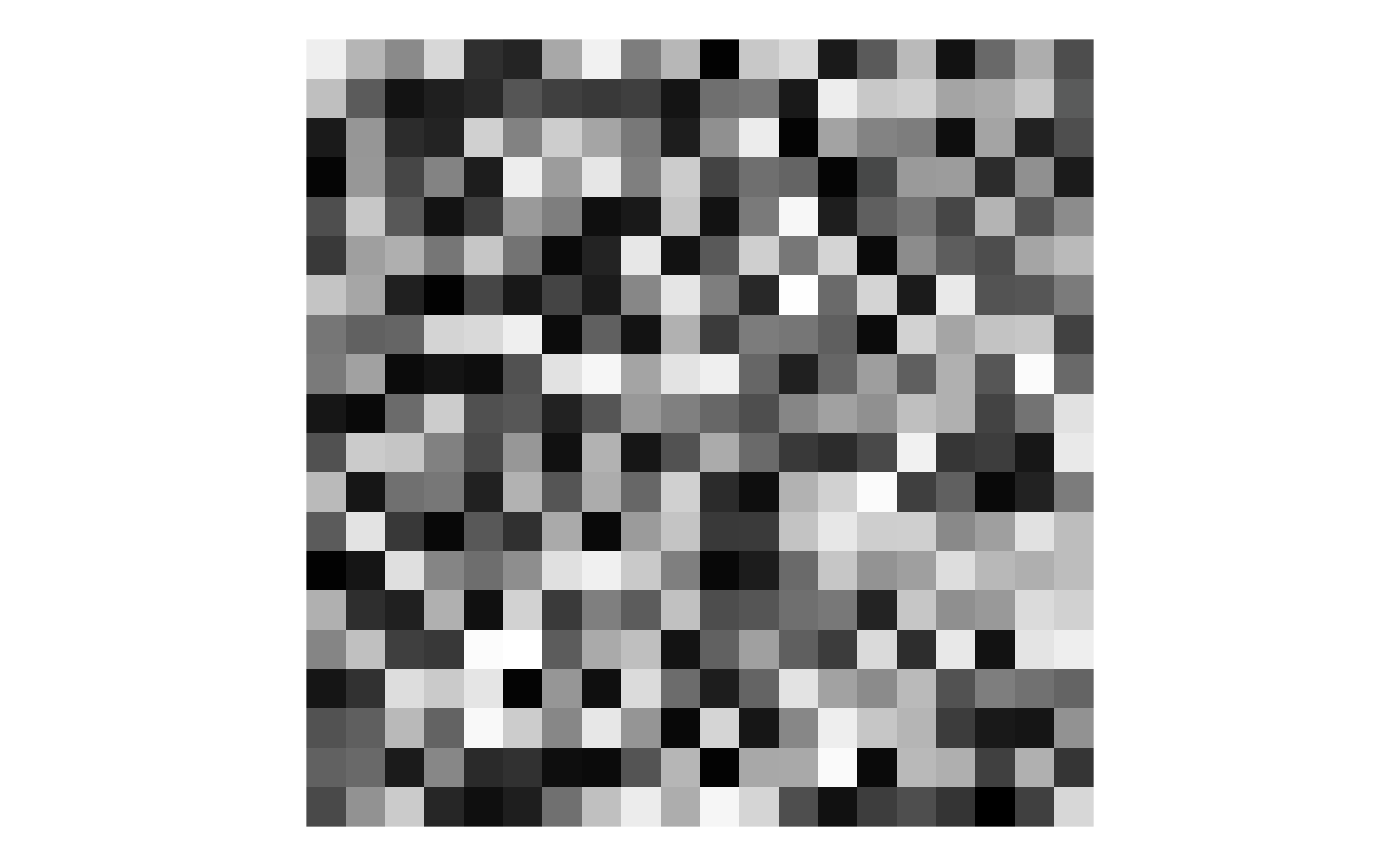
Renders a single image channel as a raster and overlays cell outlines from a segmentation mask.
Usage
sg_plot_overlay(
  image,
  mask = NULL,
  channel = 1L,
  outline_color = "#FF00FF",
  outline_width = 1,
  fill_alpha = 0,
  label_cells = FALSE,
  highlight = NULL
)
Arguments
- image
An
sg_imageobject.- mask
An
sg_maskobject, orNULLto show the image only.- channel
Integer, which channel to display (default
1L).- outline_color
Character, colour for cell outlines (default
"#FF00FF").- outline_width
Numeric, width of the outline strokes (default
1).- fill_alpha
Numeric in [0, 1], fill opacity for cell regions (default
0).- label_cells
Logical, whether to draw cell-ID labels at centroids (default
FALSE).- highlight
Integer vector of cell IDs to highlight, or
NULLfor all cells.
Examples
img <- new_sg_image(matrix(runif(400), 20, 20))
p <- sg_plot_overlay(img)
p