Loads pre-computed differential expression results (500 genes) with realistic log2 fold-changes and p-values. The first 20 genes are simulated as significantly differentially expressed.
Examples
de <- bb_example_de()
head(de[order(de$padj), ])
#> gene log2fc pvalue padj basemean
#> 1 TP53 2.339649 0.0007574367 0.02349398 997.58686
#> 2 KRAS 2.722469 0.0003361832 0.02349398 90.62812
#> 3 EGFR 2.444921 0.0008361128 0.02349398 47.01289
#> 4 BRAF 1.623780 0.0005590749 0.02349398 179.27216
#> 5 PIK3CA 1.271091 0.0004387668 0.02349398 12.32381
#> 6 PTEN 2.006420 0.0006551589 0.02349398 9793.59126
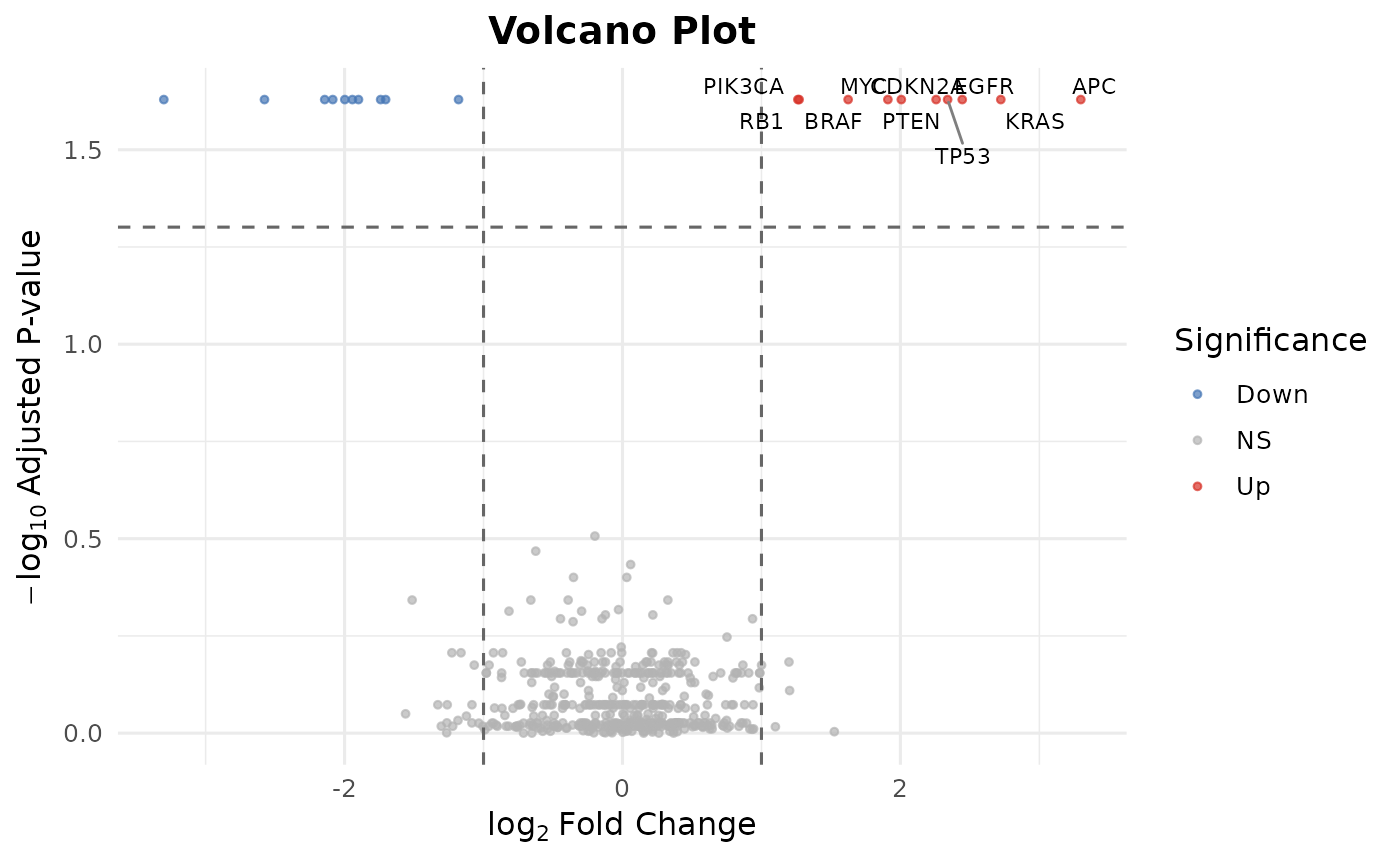
# Volcano plot
bb_volcano(de)
#> Warning: Removed 490 rows containing missing values or values outside the scale range
#> (`geom_text_repel()`).
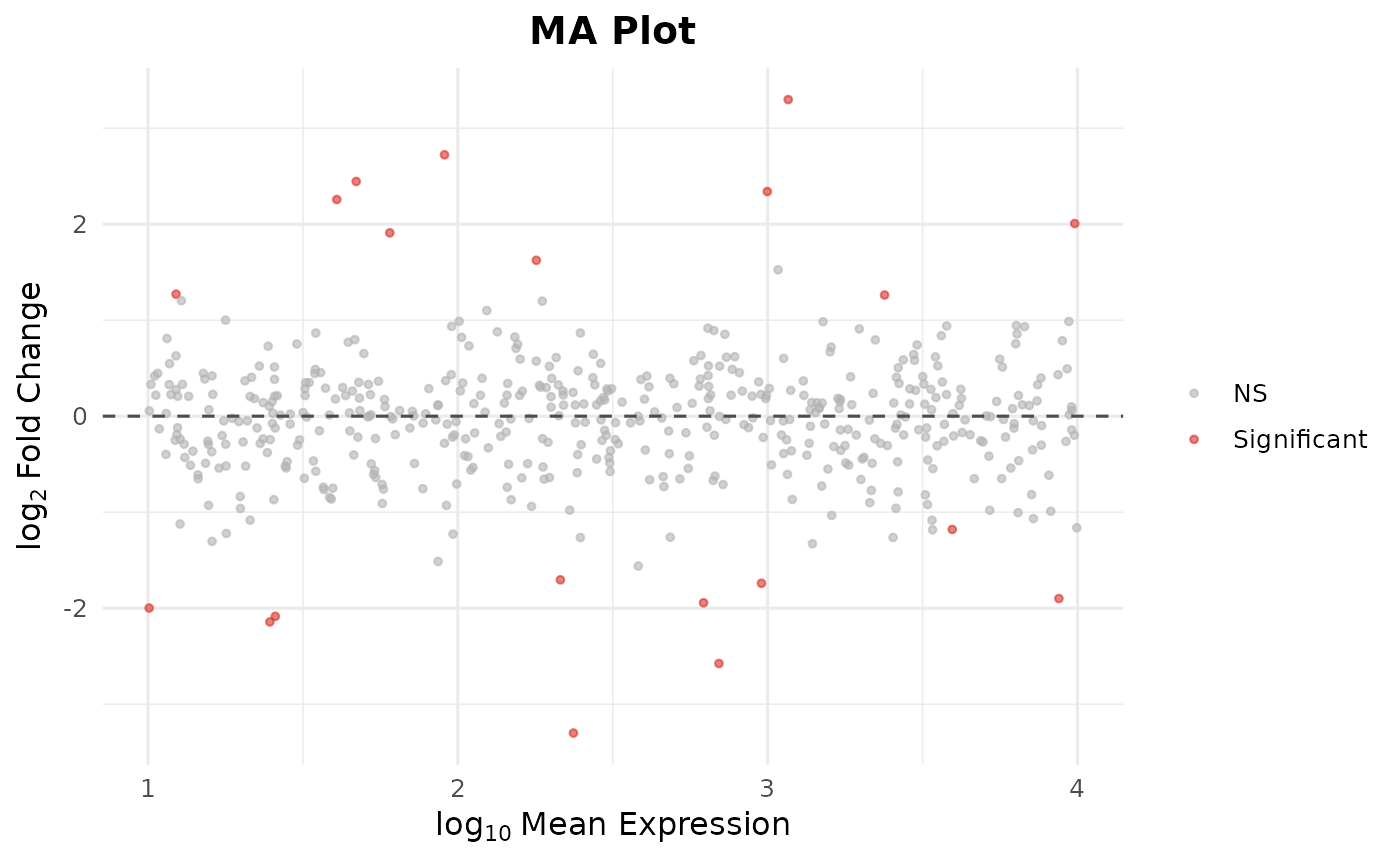
 # MA plot
bb_ma_plot(de)
# MA plot
bb_ma_plot(de)