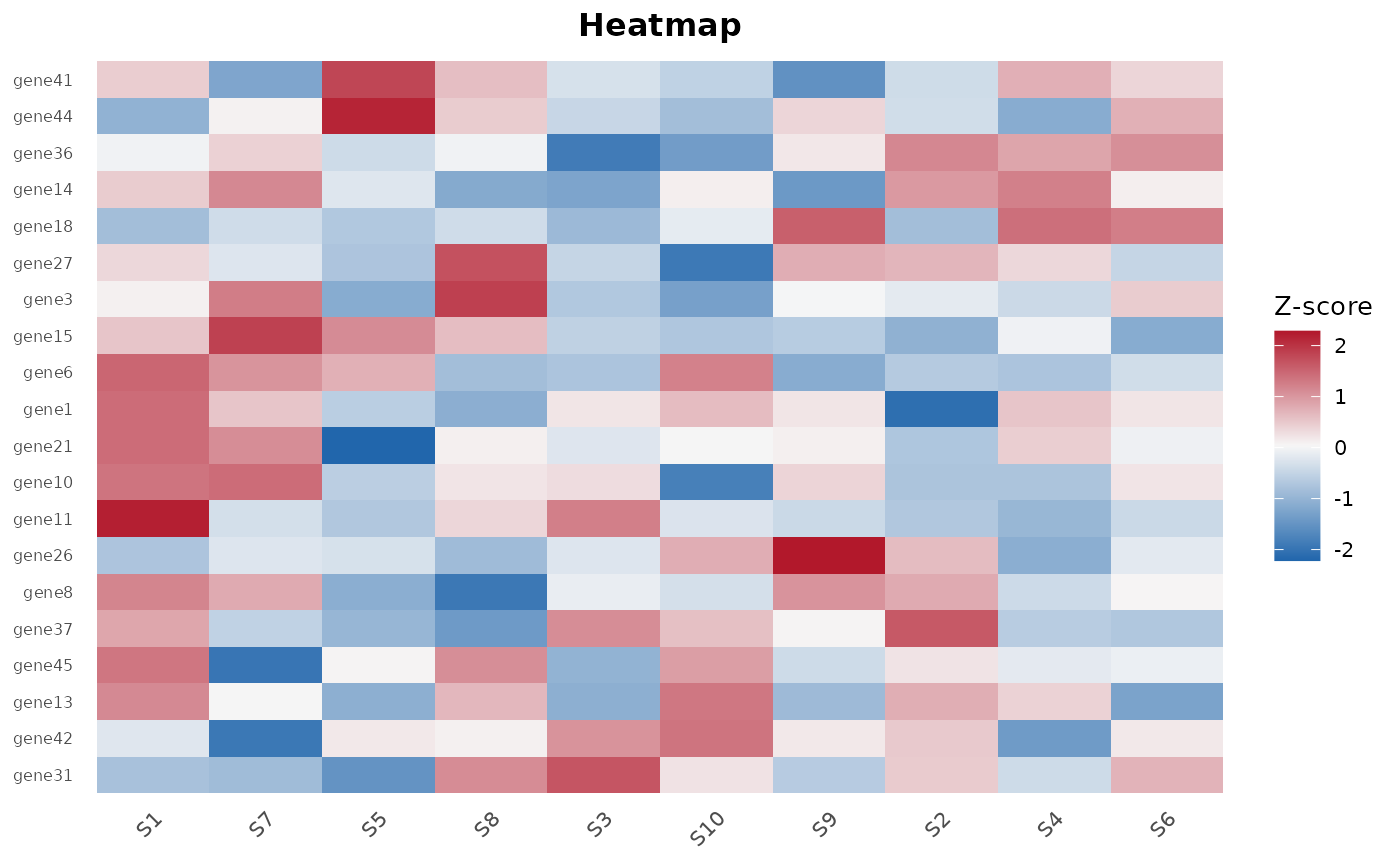
Creates a heatmap from a normalized count matrix, optionally highlighting the top DE genes.
Usage
bb_heatmap(
  counts,
  de_result = NULL,
  n_genes = 50L,
  annotation_col = NULL,
  scale = c("row", "column", "none"),
  cluster_rows = TRUE,
  cluster_cols = TRUE,
  color_palette = NULL
)
Arguments
- counts
Numeric matrix. Normalized count matrix (genes x samples).
- de_result
A data.frame with DE results. If provided, the top
n_genesby adjusted p-value are shown.- n_genes
Integer. Number of top genes to display. Default
50.- annotation_col
A data.frame for column (sample) annotations. Rownames must match column names of
counts.- scale
Character. Scale rows (
"row"), columns ("column"), or neither ("none"). Default"row".- cluster_rows
Logical. Cluster rows. Default
TRUE.- cluster_cols
Logical. Cluster columns. Default
TRUE.- color_palette
Character vector. Colors for the heatmap gradient.
Value
A ggplot2::ggplot object.