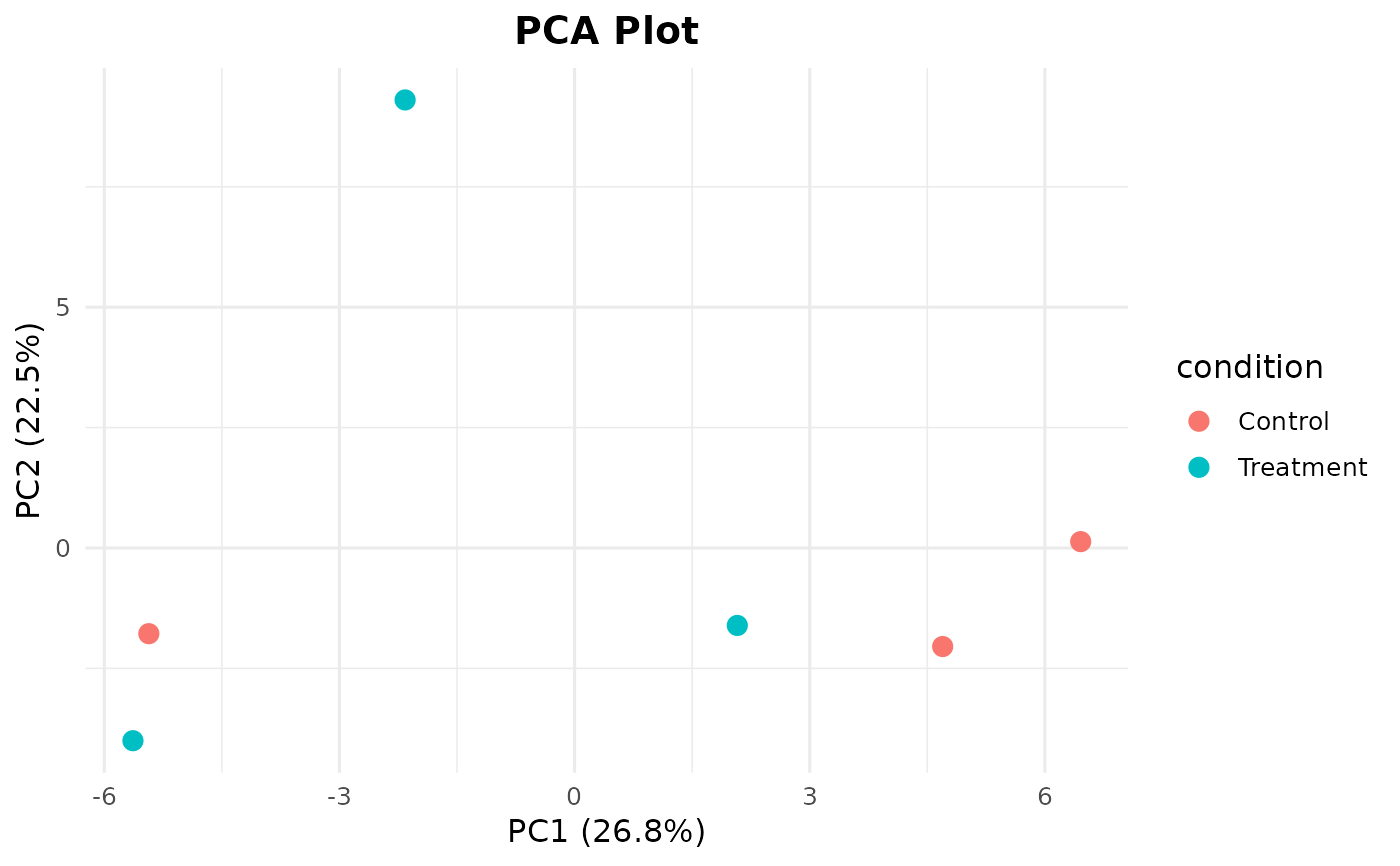
Creates a PCA plot from a normalized count matrix with sample metadata.
Usage
bb_pca(
  counts,
  metadata,
  color_by,
  shape_by = NULL,
  n_genes = 500L,
  label = FALSE,
  point_size = 3
)
Arguments
- counts
Numeric matrix. Normalized count matrix (genes x samples).
- metadata
A data.frame with sample information. Rownames must match column names of
counts.- color_by
Character. Column name in
metadatato use for coloring points.- shape_by
Character or NULL. Column name in
metadatafor point shapes.- n_genes
Integer. Number of top variable genes to use for PCA. Default
500.- label
Logical. Whether to label sample points. Default
FALSE.- point_size
Numeric. Size of points. Default
3.
Value
A ggplot2::ggplot object.