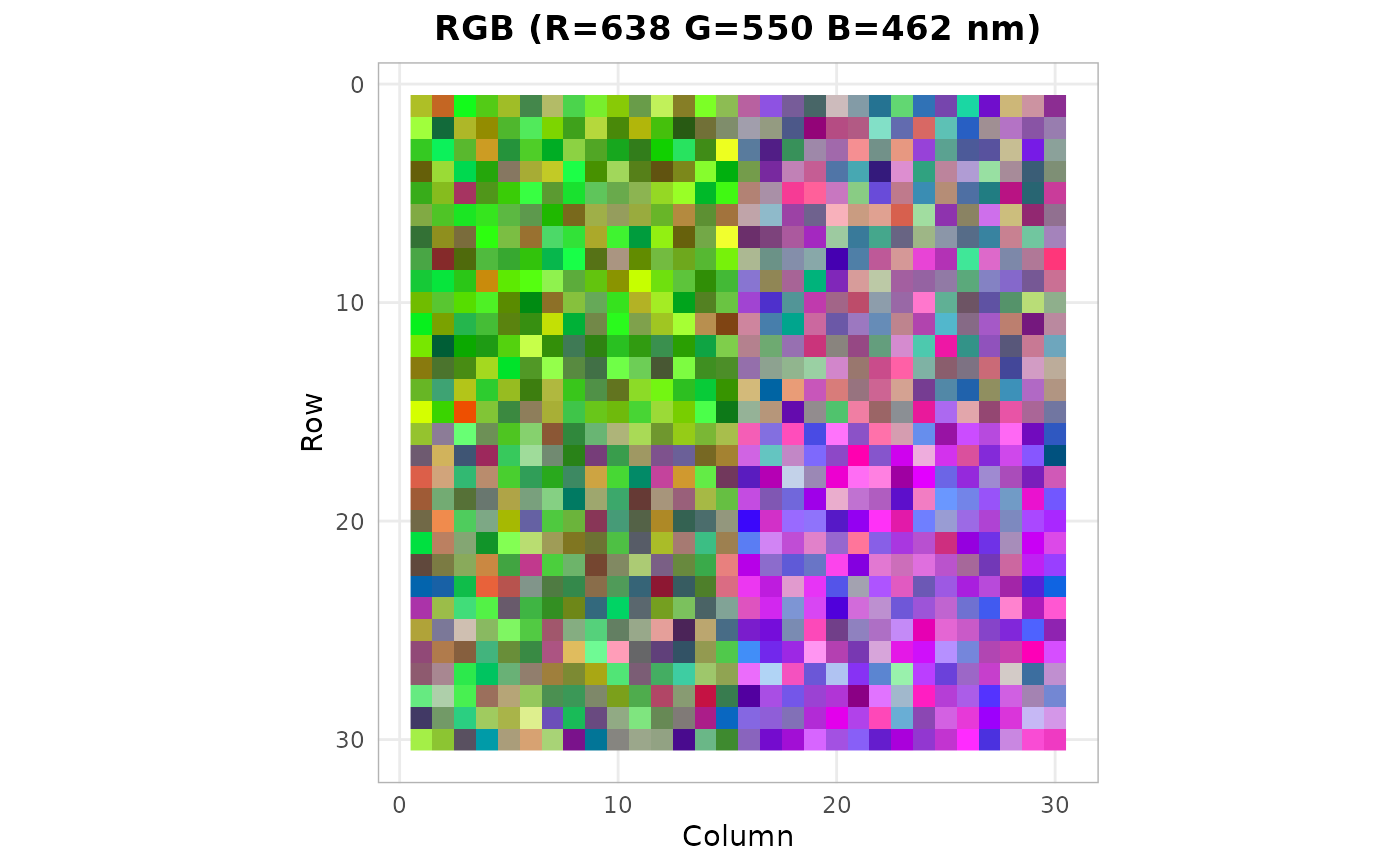
Creates a ggplot2 visualization of a hyperspectral cube. Supports RGB composite, single-band images, and spectral profile plots.
Usage
# S3 method for class 'hsi_cube'
autoplot(
  object,
  type = c("rgb", "band", "spectra"),
  band = NULL,
  wavelength = NULL,
  r = NULL,
  g = NULL,
  b = NULL,
  ...
)
Arguments
- object
An hsi_cube object.
- type
Character. Plot type:
"rgb"(default),"band", or"spectra".- band
Integer. Band index for single-band display. Used when
type = "band".- wavelength
Numeric. Wavelength (nm) for single-band display. Alternative to
band.- r, g, b
Numeric. Wavelengths for RGB channels. Defaults: 640, 550, 460.
- ...
Additional arguments passed to internal plot functions.
Value
A ggplot2::ggplot object.
Examples
cube <- hs_example_cube()
ggplot2::autoplot(cube, type = "rgb")