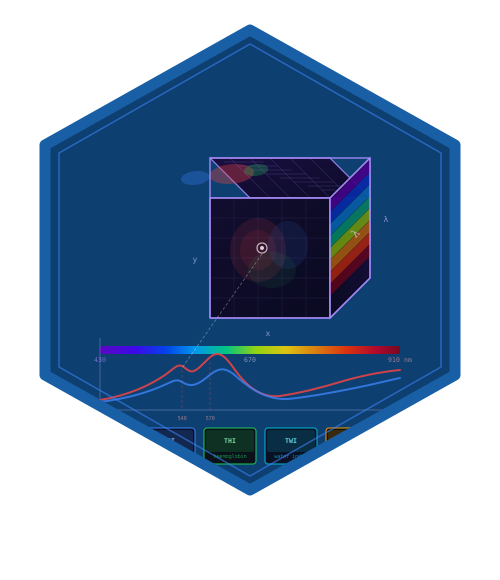

hyperspectR provides a complete R pipeline for biomedical hyperspectral imaging analysis – from raw camera data to clinical tissue oxygenation maps.
Quick Start
library(hyperspectR)

# Load example cube (synthetic 30x30 tissue scene, 61 bands, 430-910 nm)
cube <- hs_example_cube()
print(cube)

# Plot RGB composite
autoplot(cube, type = "rgb")

# Compute tissue oxygenation
sto2 <- hs_sto2(cube)
hs_plot_index(sto2, title = "StO2 (%)", palette = "sto2")

# Clinical 5-panel display (TIVITA-style)
hs_plot_clinical(cube)

# Launch interactive explorer
hs_run_app(cube)
Features
- I/O: Read ENVI, multi-channel TIFF, and Cubert .cu3s files
- Calibration: Dark correction, white reference normalization, bad pixel repair
- Preprocessing: Savitzky-Golay smoothing, SNV, MSC, spectral derivatives
- Biomedical indices: StO2, NPI, THI, TWI, custom normalized difference indices
- Analysis: PCA, MNF, SAM classification, SVM/RF pixel classification, Beer-Lambert unmixing
- Visualization: ggplot2-based spectral plots, clinical panel displays, interactive Shiny app
- Clinical focus: Intraoperative oxygenation mapping, compartment syndrome assessment
Use of LLM tools
Portions of this package were prepared with assistance from large language model tooling for narrowly defined, non-authorial tasks: copyediting, prose smoothing, Markdown/LaTeX formatting, scaffolding of boilerplate files (CI configs, build scripts), code refactoring. The tools used were Chat AI, the LLM service of KISSKI (GWDG), and a self-hosted Mistral Small (24B, Apache-2.0) run locally via Ollama and the ollamar R package — local inference only, with no data sent to third parties for the self-hosted model.