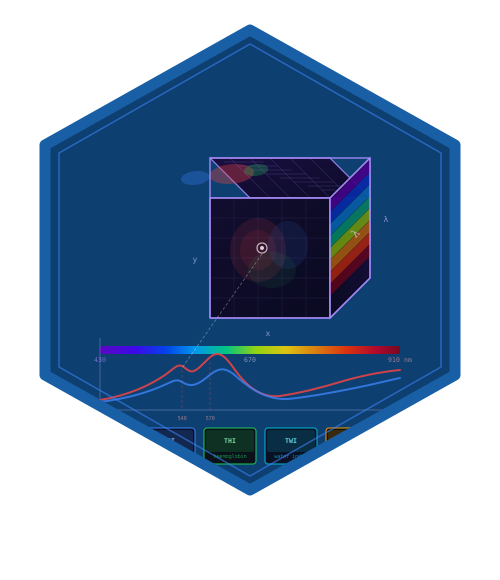
Estimates pixel-wise concentrations of tissue chromophores by fitting absorbance spectra to published extinction coefficient spectra using NNLS.
Arguments
- cube
An hsi_cube object. If reflectance, automatically converted to absorbance internally.
- chromophores
Character vector. Default
c("HbO2", "Hb").- wavelength_range
Numeric vector of length 2. Fitting range. Default
c(500, 600)(Hb Q-band region for best contrast).
Value
A list with class "hsi_chromophore_fit":
- concentrations
Named list of matrices (one per chromophore).
- sto2
Matrix of oxygen saturation = HbO2 / (HbO2 + Hb) * 100.
- total_hb
Matrix of total hemoglobin = HbO2 + Hb.
- rmse
Matrix of fit residuals.
Examples
cube <- hs_example_cube()
fit <- hs_beer_lambert(cube)
range(fit$sto2, na.rm = TRUE)
#> [1] 42.1452 73.0292