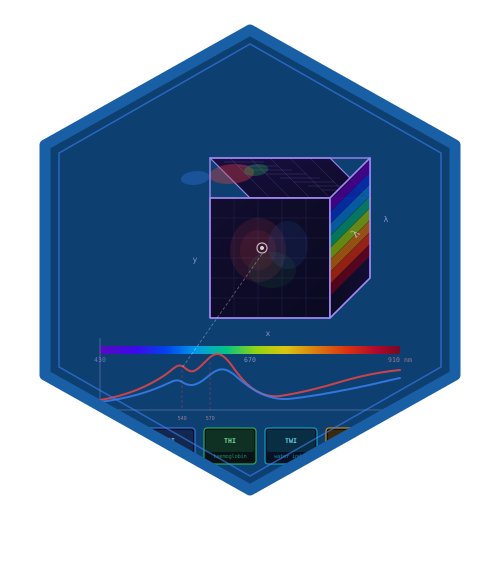
Returns a pinned tabulation of decadic molar extinction coefficients for hemoglobin, compiled by Prahl and distributed with MNE-Python v1.10.2. Synthetic shapes are available separately for simulation only.
Arguments
- chromophore
Character vector. One or more of:
"HbO2"(oxyhemoglobin),"Hb"(deoxyhemoglobin),"water","melanin","metHb"(methemoglobin). Defaultc("HbO2", "Hb").- wavelength_range
Numeric vector of length 2. Wavelength range in nm. Default
c(400, 1000).- source
"reference"(default) supports HbO2 and Hb;"synthetic"returns the legacy analytical shapes, unsuitable for quantitative fitting.
Value
A tibble::tibble with columns wavelength (nm) and one column per
requested chromophore (extinction coefficient in cm^-1 / (mol/L)).
Examples
hb_data <- hs_chromophore_data()
head(hb_data)
#> # A tibble: 6 × 3
#>   wavelength   HbO2     Hb
#>        <dbl>  <dbl>  <dbl>
#> 1        400 266232 223296
#> 2        402 284224 236188
#> 3        404 308716 253368
#> 4        406 354208 270548
#> 5        408 422320 287356
#> 6        410 466840 303956