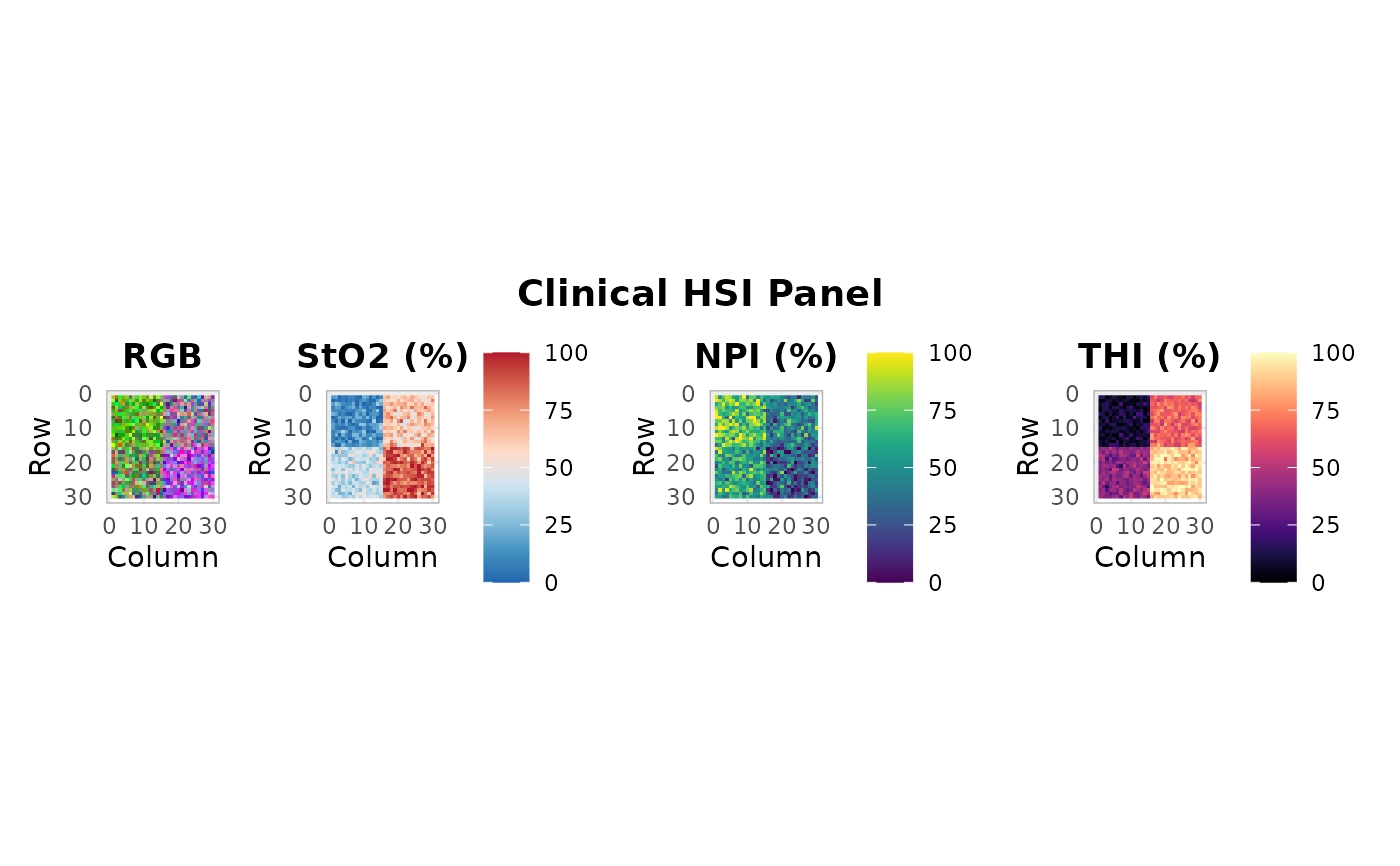
Generates a side-by-side panel display of RGB image plus clinical tissue indices (StO2, NPI, THI, TWI), matching the established surgical HSI visualization paradigm.
Usage
hs_plot_clinical(
  cube,
  indices = c("sto2", "npi", "thi"),
  mask_background = TRUE,
  threshold = 0.05,
  ncol = NULL
)
Arguments
- cube
An hsi_cube object with reflectance data.
- indices
Character vector. Which indices to display. Default
c("sto2", "npi", "thi"). TWI is included only if wavelengths permit.- mask_background
Logical. Mask non-tissue pixels. Default
TRUE.- threshold
Numeric. Masking threshold on mean reflectance. Default
0.05.- ncol
Integer. Number of panel columns. Default
NULL(auto).
Value
A patchwork composite ggplot2::ggplot object.
Examples
cube <- hs_example_cube()
hs_plot_clinical(cube)