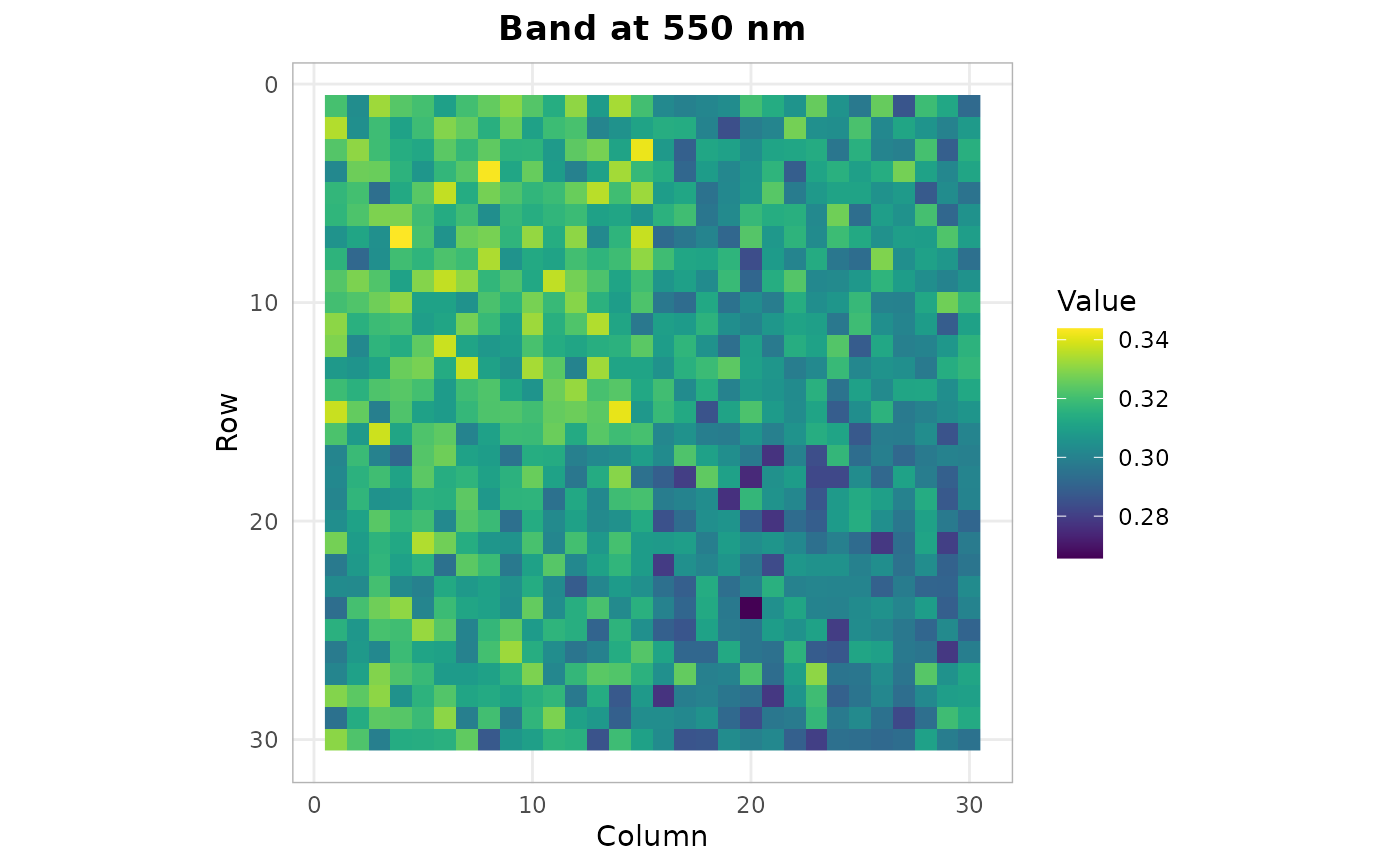
Displays a single spectral band as a spatial image using a pseudocolor palette.
Arguments
- cube
An hsi_cube object.
- wavelength
Numeric. Center wavelength to display (nearest band selected). Default
NULL.- band
Integer. Band index. Alternative to
wavelength. DefaultNULL.- palette
Character. Color palette name. Default
"viridis".
Value
A ggplot2::ggplot object using ggplot2::geom_raster().
Examples
cube <- hs_example_cube()
hs_plot_image(cube, wavelength = 550)