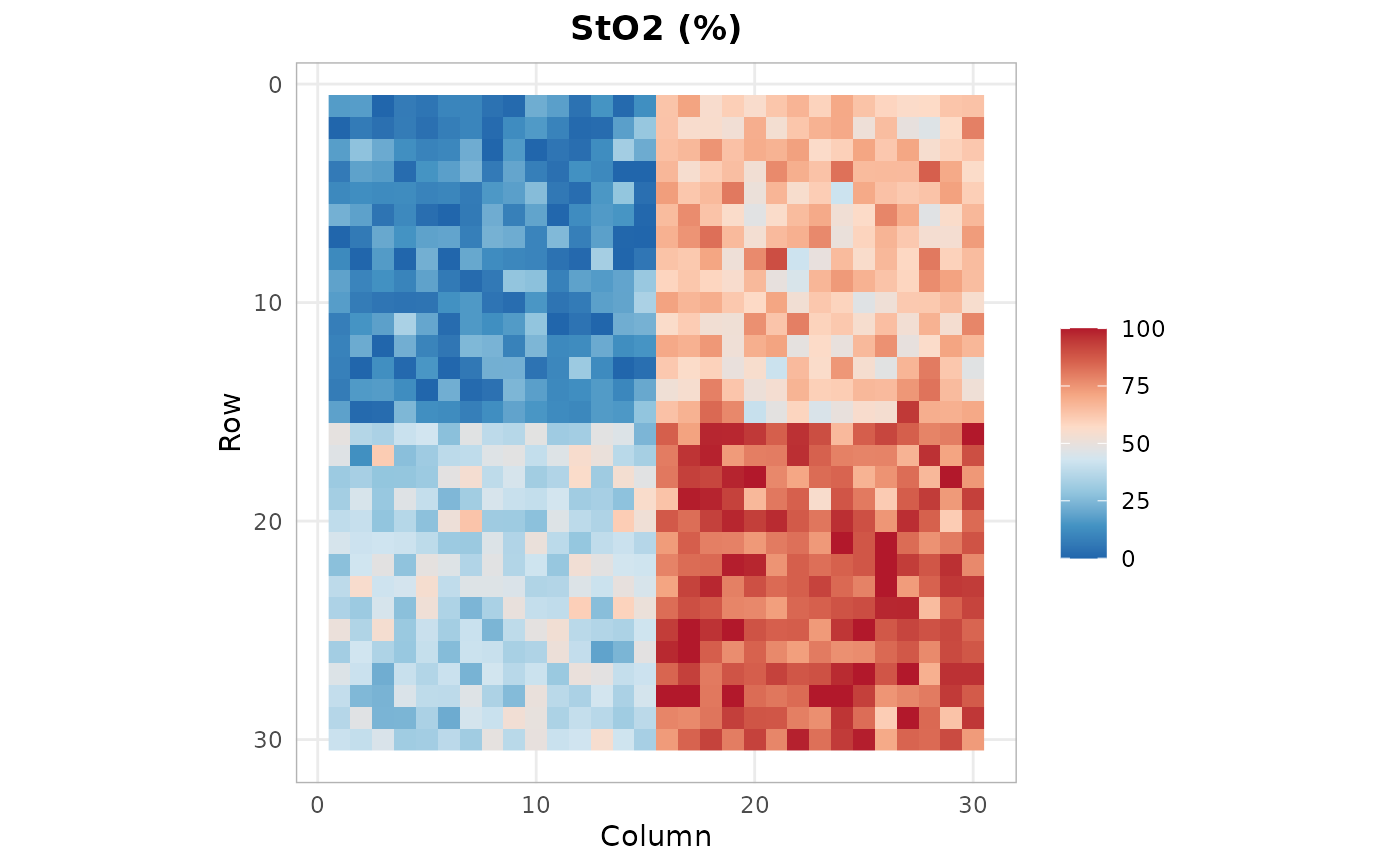
Displays a single tissue index as a pseudocolor spatial map with clinically meaningful color scales.
Usage
hs_plot_index(
  index_matrix,
  title = "",
  palette = "sto2",
  range = c(0, 100),
  mask = NULL
)
Arguments
- index_matrix
Numeric matrix (rows x cols) from an index function.
- title
Character. Map title (e.g., "StO2 (%)"). Default
"".- palette
Character.
"sto2"(blue-red diverging),"perfusion"(viridis),"hemoglobin"(magma),"water"(mako). Default"sto2".- range
Numeric vector of length 2. Display range. Default
c(0, 100).- mask
Logical matrix. Pixels to mask (FALSE = masked). Default
NULL.
Value
A ggplot2::ggplot object.
Examples
cube <- hs_example_cube()
sto2 <- hs_sto2(cube)
hs_plot_index(sto2, title = "StO2 (%)", palette = "sto2")