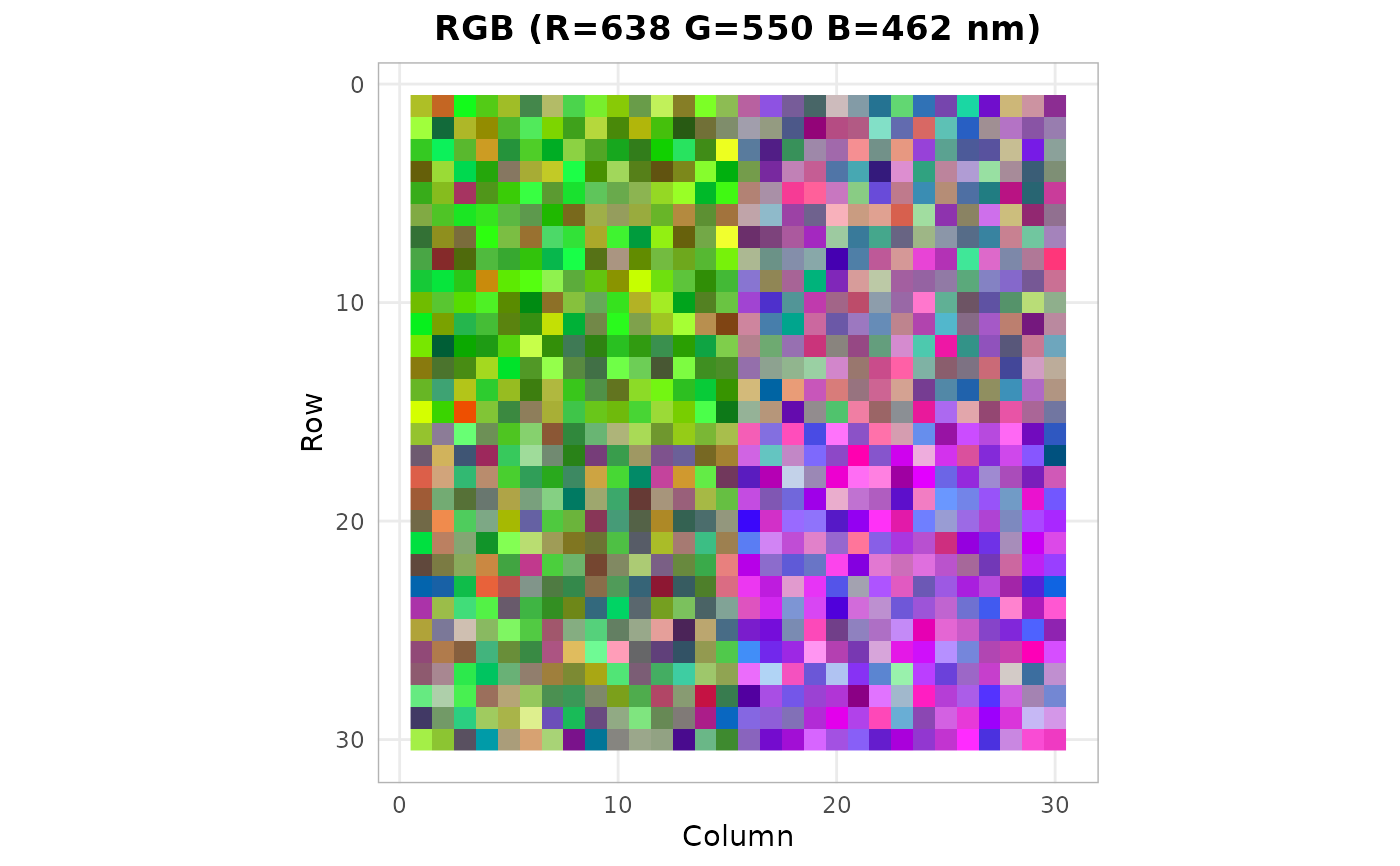
Creates a pseudo-color RGB composite by mapping three wavelength bands to the red, green, and blue channels.
Arguments
- cube
An hsi_cube object.
- r, g, b
Numeric. Center wavelengths for R, G, B channels. Defaults: r=640, g=550, b=460.
- stretch
Character. Histogram stretch:
"linear"(default),"none".
Value
A ggplot2::ggplot object.
Examples
cube <- hs_example_cube()
hs_plot_rgb(cube)