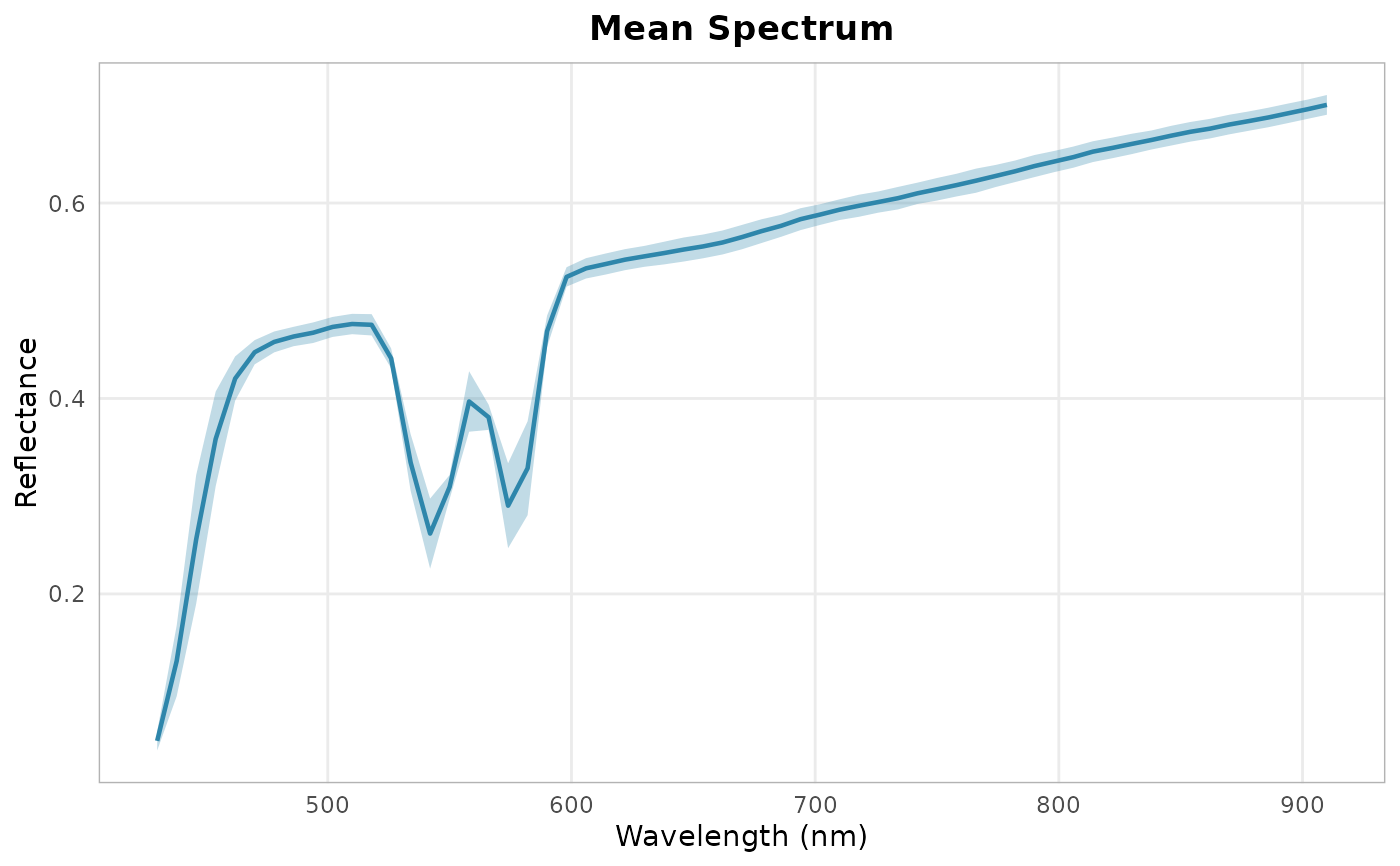
Displays spectral profiles from an HSI cube. Can show mean spectrum, random pixel spectra, or spectra from specific pixel locations.
Arguments
- cube
An hsi_cube object.
- pixels
Character or data.frame.
"mean"for spatial mean,"random"for random pixel sample, or a data.frame with columnsxandy. Default"mean".- n
Integer. Number of random spectra if
pixels = "random". Default100.- show_sd
Logical. Show mean +/- SD ribbon. Default
TRUEwhenpixels = "mean".
Value
A ggplot2::ggplot object.
Examples
cube <- hs_example_cube()
hs_plot_spectra(cube)