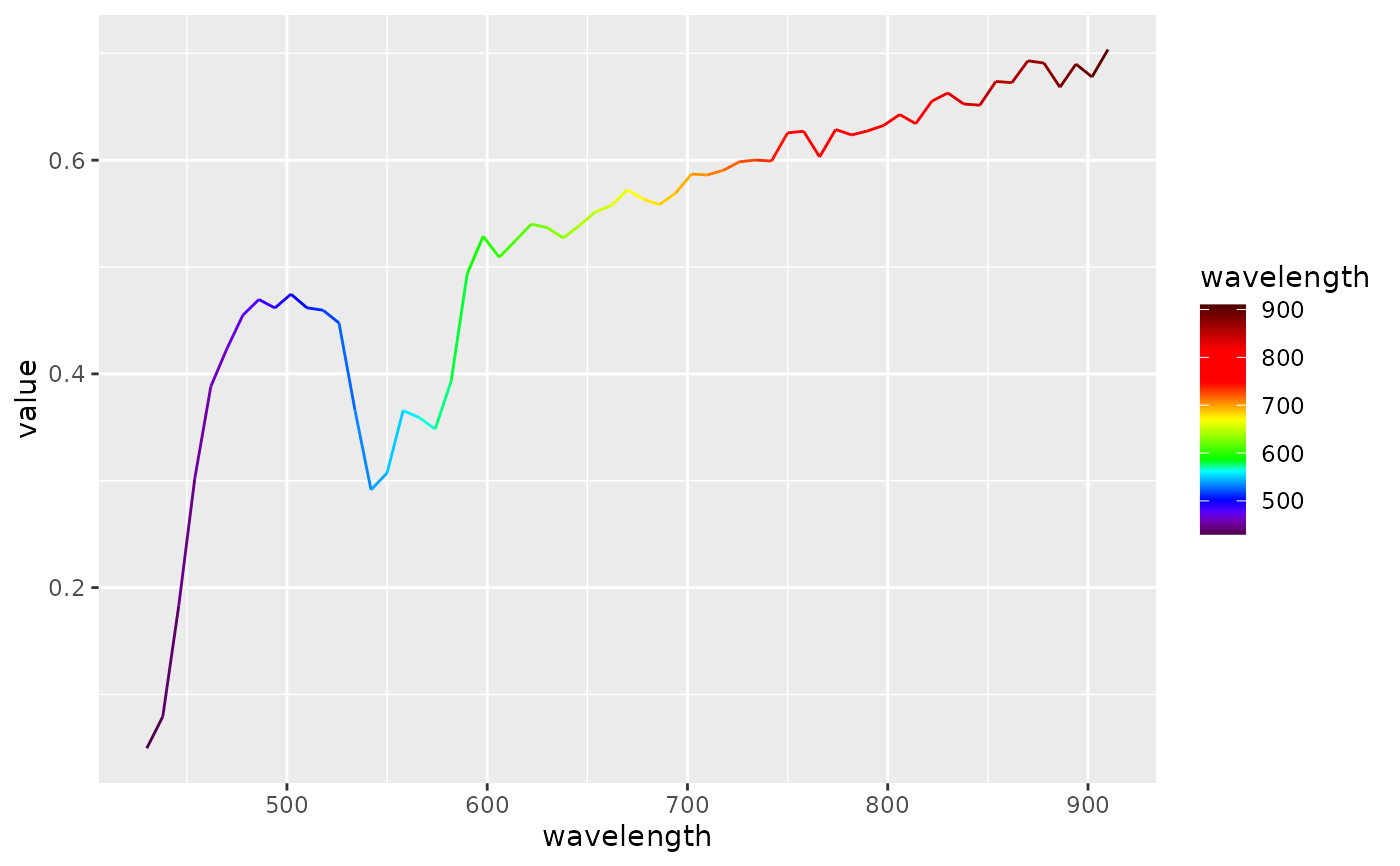
Maps wavelength values to approximate visible light colors for spectral line coloring. Returns a ggplot2 continuous color scale.
Arguments
- ...
Additional arguments passed to
ggplot2::scale_color_gradientn().
Value
A ggplot2::Scale object.
Examples
cube <- hs_example_cube()
library(ggplot2)
df <- data.frame(
  wavelength = cube$wavelengths,
  value = cube$data[15, 15, ]
)
ggplot(df, aes(wavelength, value, color = wavelength)) +
  geom_line() +
  scale_color_wavelength()