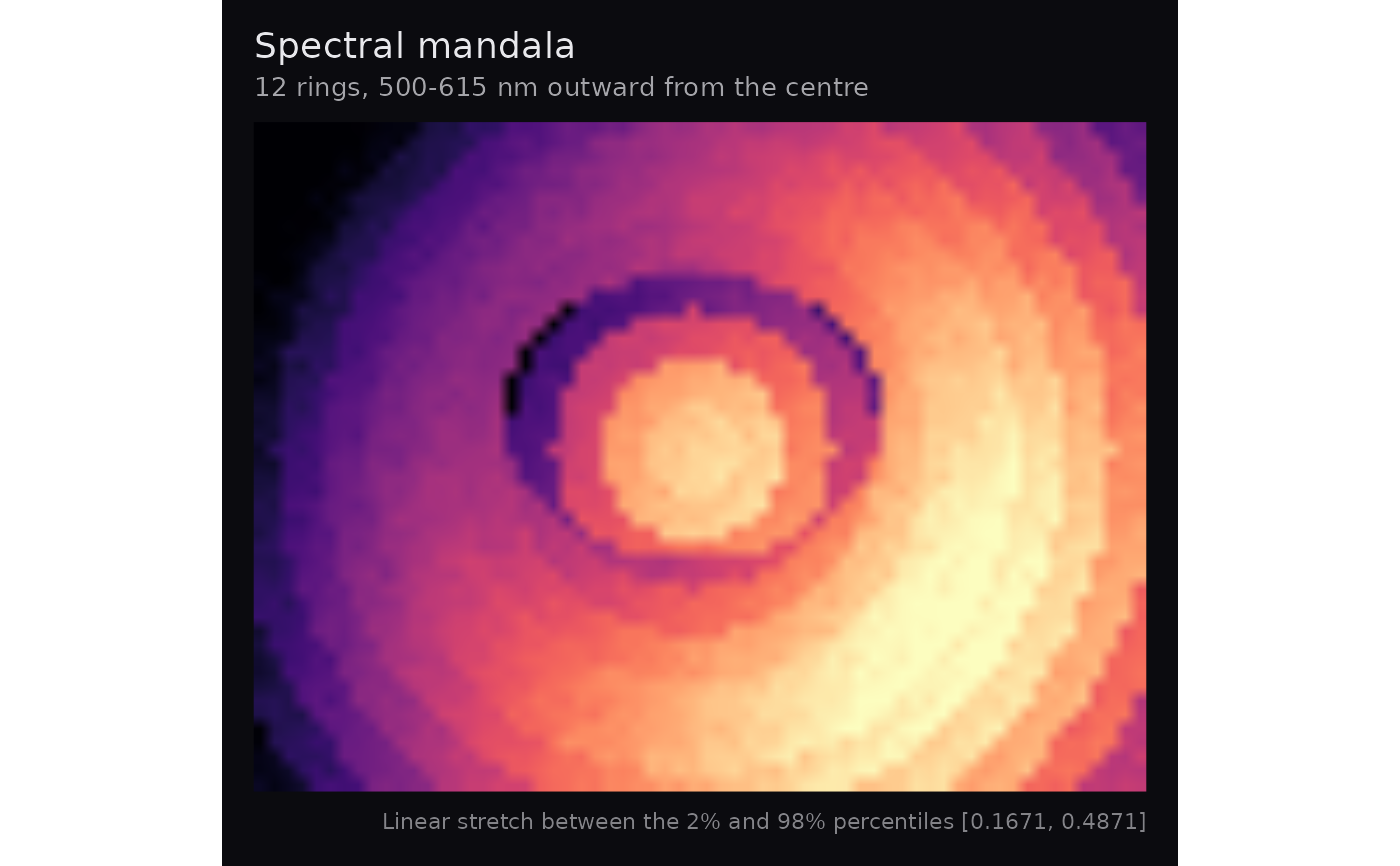
Renders the scene as concentric annuli, each drawn from a sampled spectral band: the innermost ring uses the first band and the outermost uses the last. The result is a spatial composition; unequal annular areas do not estimate the spectral distribution. A single ring selects the first band.
Arguments
- cube
An
hsi_cube(from hyperspectR) or a 3-D array with dimensions(rows, cols, bands), of integer or double values. Optionalwavelengthsmetadata must be finite, unique and strictly increasing in nm. Without it, coordinates are band indices. An optional logical spatialmaskhas dimensions(rows, cols)and no missing entries;FALSEexcludes a pixel. Arrays may carry these as attributes; anhsi_cubemay carry them as list fields. Nonfinite observations are excluded.- centre
Numeric length-2 vector
c(x, y)in pixels.NULL(default) uses the image centre.- n_rings
Number of annuli. Default
36. More rings sample the spectrum more finely; fewer give bolder banding.- palette
Palette name passed to
hsa_palette().- stretch
Contrast stretch:
"percentile"(default),"range"or"none".- probs
Percentiles for
stretch = "percentile". Defaultc(0.02, 0.98).- display_limits
Two increasing finite endpoints used as the fixed colour domain for
stretch = "none". Defaultc(0, 1).- value_label
A truthful label for the input values. Default
"input value". A reflectance label requires known upstream calibration; numeric range alone cannot establish calibration.- interpolate
Logical; interpolate raster pixels. Default
TRUE.- sampling
Ring targets:
"index"(default) or"wavelength". Wavelength sampling requires physical metadata in nm.
Details
This uses the spectral dimension for a spatial composition. A single band or repeated ring selections can produce a degenerate single-band result. The default radius-to-band-index mapping is linear. Wavelength sampling uses equally spaced physical targets and nearest measured bands, with ties toward shorter wavelengths. Repeated selections and empty rings retain the geometry and are disclosed in the caption and provenance.
Examples
cube <- hsa_demo_cube()
hsa_mandala(cube, n_rings = 12)