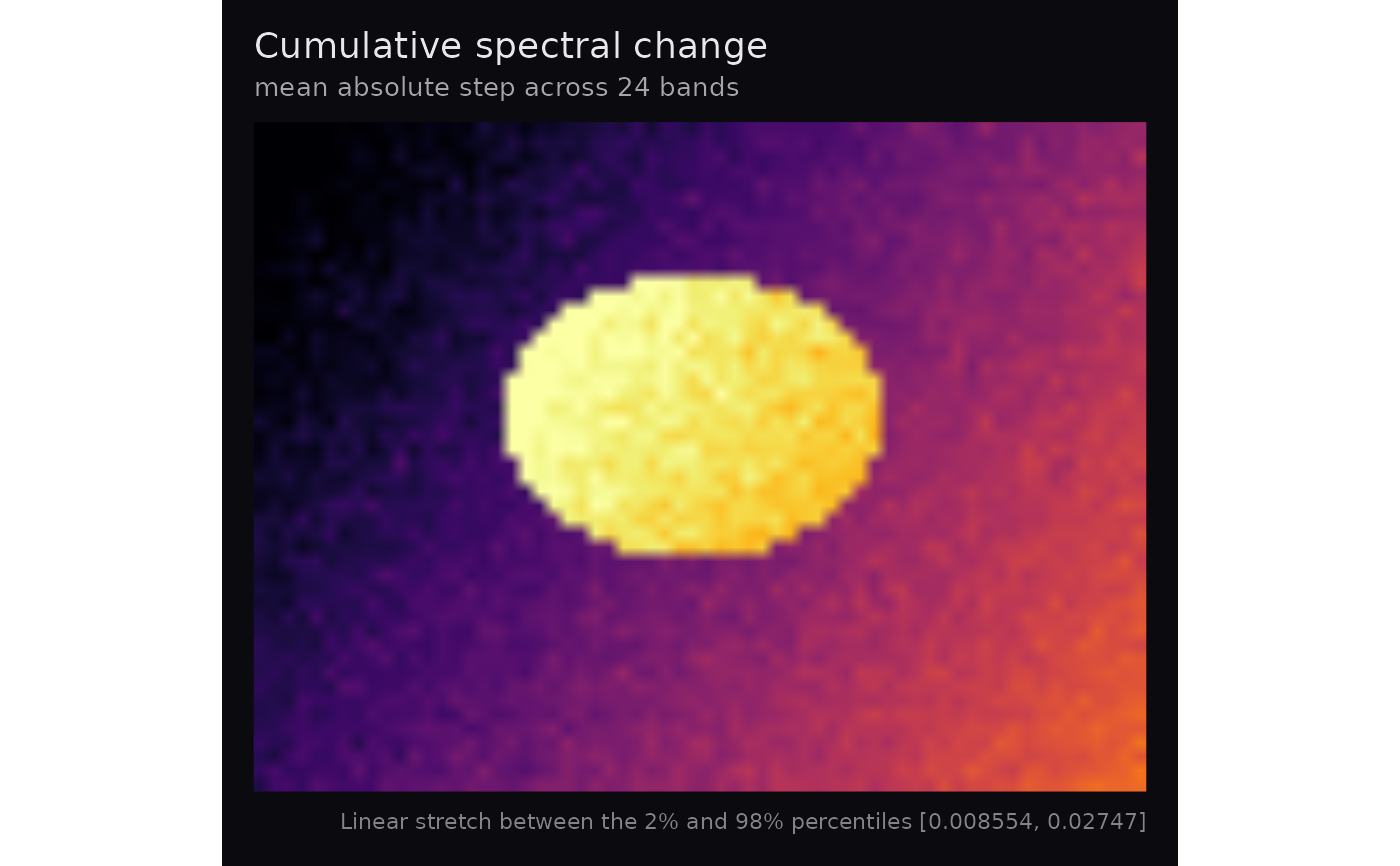
Sums the absolute change between consecutive bands at every pixel, giving a field of total spectral variability. Flat spectra appear dark; pixels whose input values change across the spectrum appear bright.
Arguments
- cube
An
hsi_cube(from hyperspectR) or a 3-D array with dimensions(rows, cols, bands), of integer or double values. Optionalwavelengthsmetadata must be finite, unique and strictly increasing in nm. Without it, coordinates are band indices. An optional logical spatialmaskhas dimensions(rows, cols)and no missing entries;FALSEexcludes a pixel. Arrays may carry these as attributes; anhsi_cubemay carry them as list fields. Nonfinite observations are excluded.- palette
Palette name passed to
hsa_palette().- normalise
Logical. Divide by the number of band steps, so the value is a mean absolute step rather than a total. Default
TRUE.- stretch
Contrast stretch:
"percentile"(default),"range"or"none".- probs
Percentiles for
stretch = "percentile". Defaultc(0.02, 0.98).- display_limits
Two increasing finite endpoints used as the fixed colour domain for
stretch = "none". Defaultc(0, 1).- value_label
A truthful label for the input values. Default
"input value". A reflectance label requires known upstream calibration; numeric range alone cannot establish calibration.- interpolate
Logical; interpolate raster pixels. Default
TRUE.- normalization
NULLpreservesnormalise; otherwise"total","mean_step", or"wavelength_span"selects V, V/(B-1), or V/L, where V = sum(abs(diff(x))) and L is the endpoint wavelength span. Contradictory explicitnormaliseandnormalizationsettings are rejected.
Details
Unlike a single-band image this cannot be produced from any one wavelength, and unlike a variance map it is sensitive to the ordering of the bands, so it responds to spectral shape rather than spread alone.
Wavelength-span normalization requires at least two physical wavelengths in nm and a finite positive representable span. It measures mean absolute slope of the piecewise-linear spectrum in input-value units per nm. Gaps bridge unobserved structure; this does not correct sampling density, unresolved peaks, or measurement noise. Every band must be finite at a valid pixel. Nonrepresentable requested arithmetic raises an error.
Examples
cube <- hsa_demo_cube()
hsa_spectral_flux(cube)