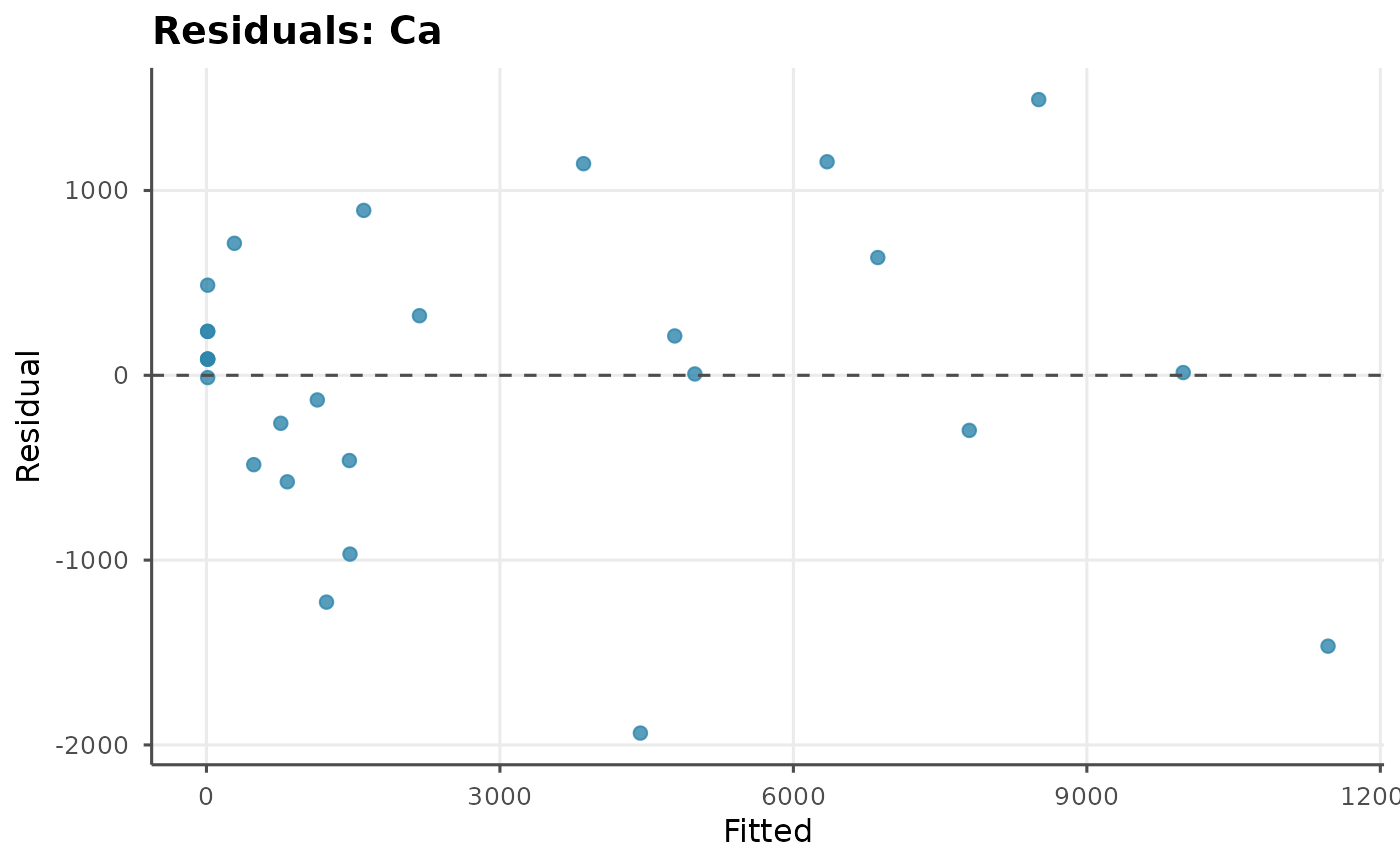
Standard regression diagnostic: residuals vs fitted.
Arguments
- calibration
A
ls_calibration()object.
Examples
ds <- ls_example_data("calibration")
conc <- ds$sample_info$concentration
cal <- ls_calibrate(ds, "Ca", 393.37, conc, verbose = FALSE)
ls_plot_residuals(cal)