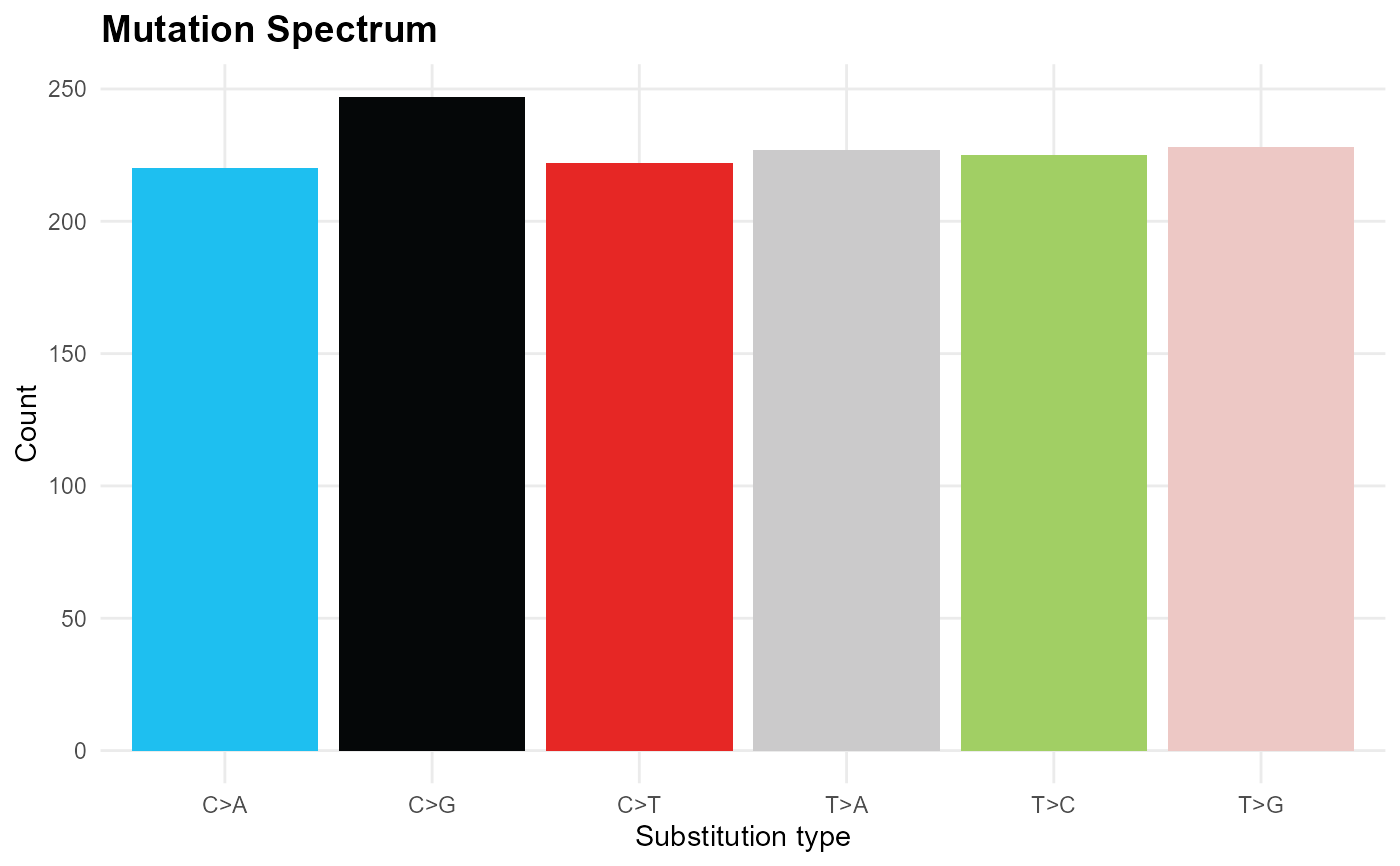
Bar chart of SNV substitution types (C>A, C>G, C>T, T>A, T>C, T>G).
Value
A ggplot2::ggplot object.
Examples
# \donttest{
db <- mp_example_db(n_patients = 20, seed = 1)
mp_plot_mutation_spectrum(db)

# }
# }
Bar chart of SNV substitution types (C>A, C>G, C>T, T>A, T>C, T>G).
A ggplot2::ggplot object.
# \donttest{
db <- mp_example_db(n_patients = 20, seed = 1)
mp_plot_mutation_spectrum(db)
# }