Creates Kaplan-Meier curves from the survival table. Optionally stratifies by a clinical variable or gene mutation status.
Usage
mp_plot_survival(db, group_by = NULL, type = c("os", "pfs"))Arguments
- db
A
molpath_dbobject.- group_by
Optional character string. If it matches a column in the patients table (e.g.,
"diagnosis"), stratify by that variable. If it matches a gene name present in the variants table, stratify into "Mutated" vs "Wild-type".- type
Character;
"os"for overall survival or"pfs"for progression-free survival.
Value
A ggplot2::ggplot object.
Examples
# \donttest{
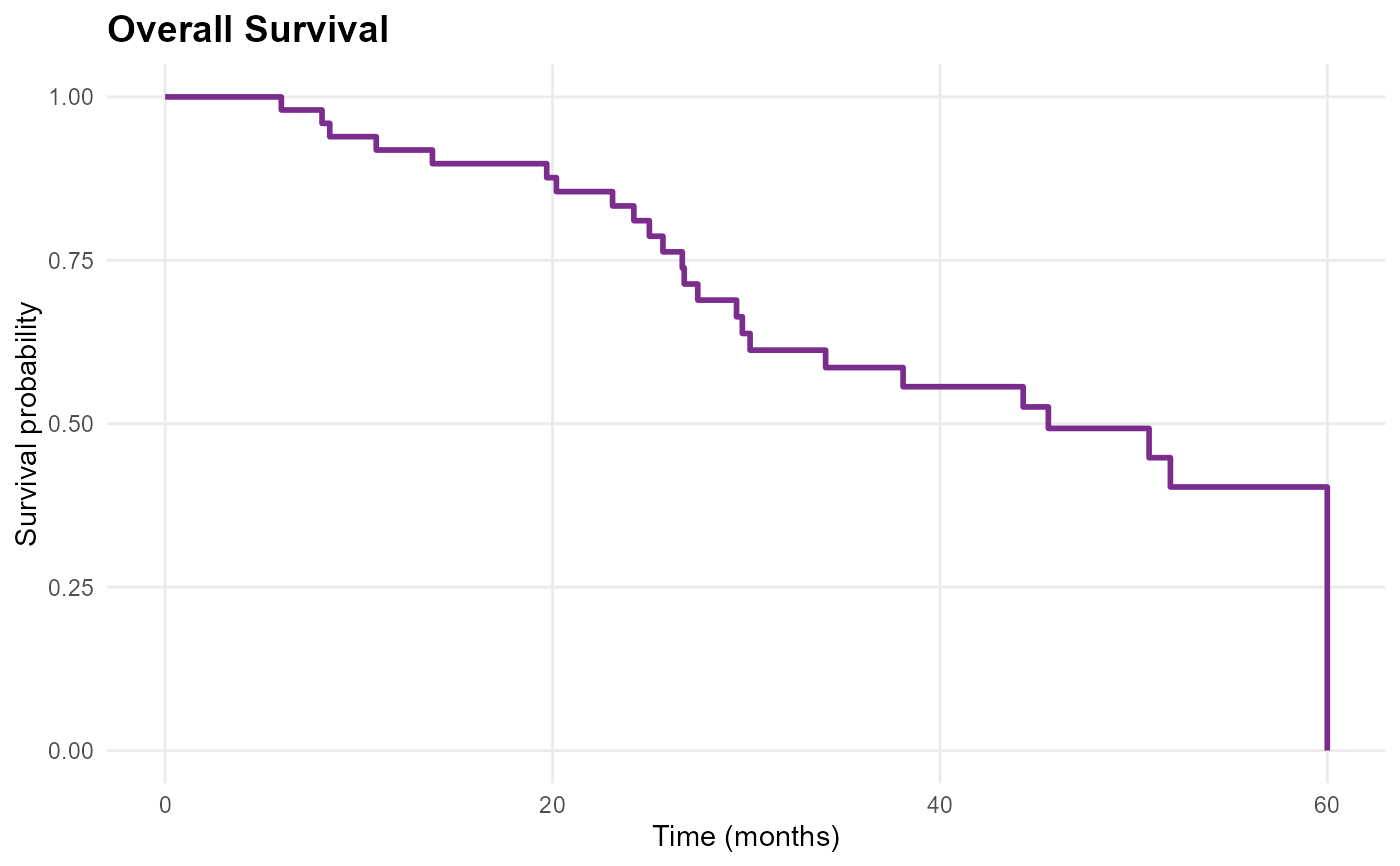
db <- mp_example_db(n_patients = 50, seed = 1)
mp_plot_survival(db, type = "os")
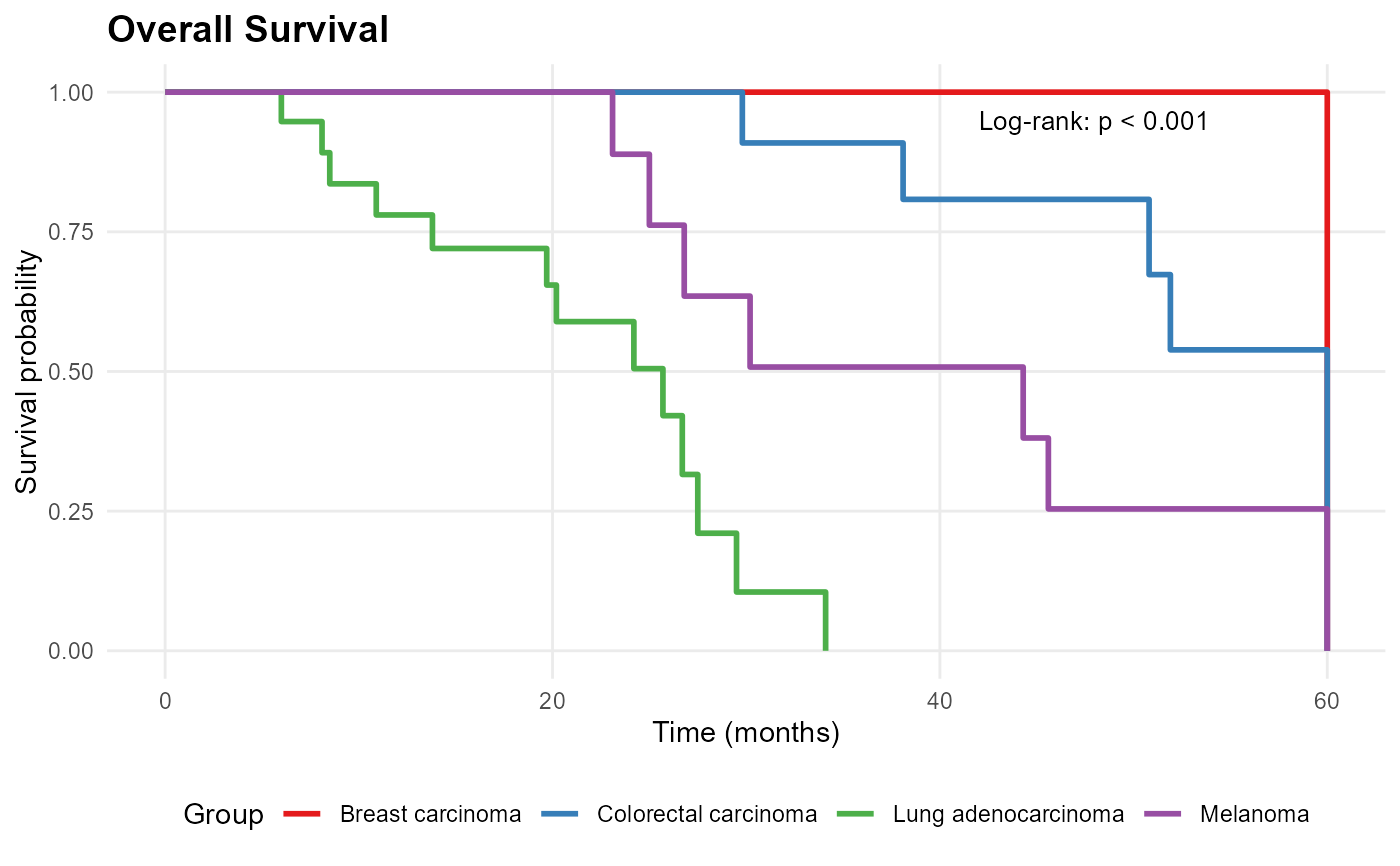
 mp_plot_survival(db, group_by = "diagnosis", type = "os")
 # }
# }