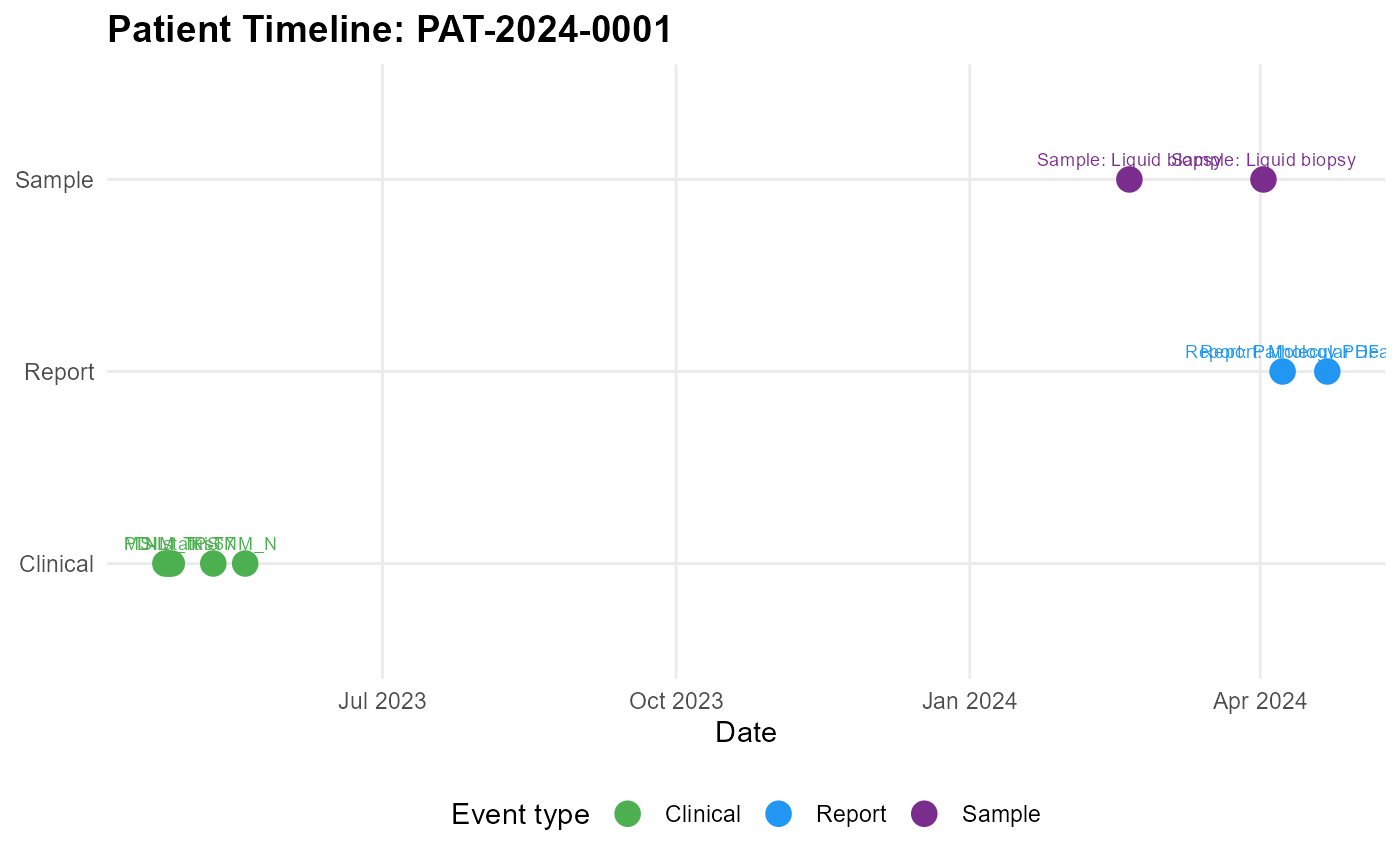
Displays a timeline of events for a single patient: sample collections, report dates, and clinical measurements.
Value
A ggplot2::ggplot object.
Examples
# \donttest{
db <- mp_example_db(n_patients = 20, seed = 1)
pid <- db$patients$patient_id[1]
mp_plot_timeline(db, pid)

# }
# }