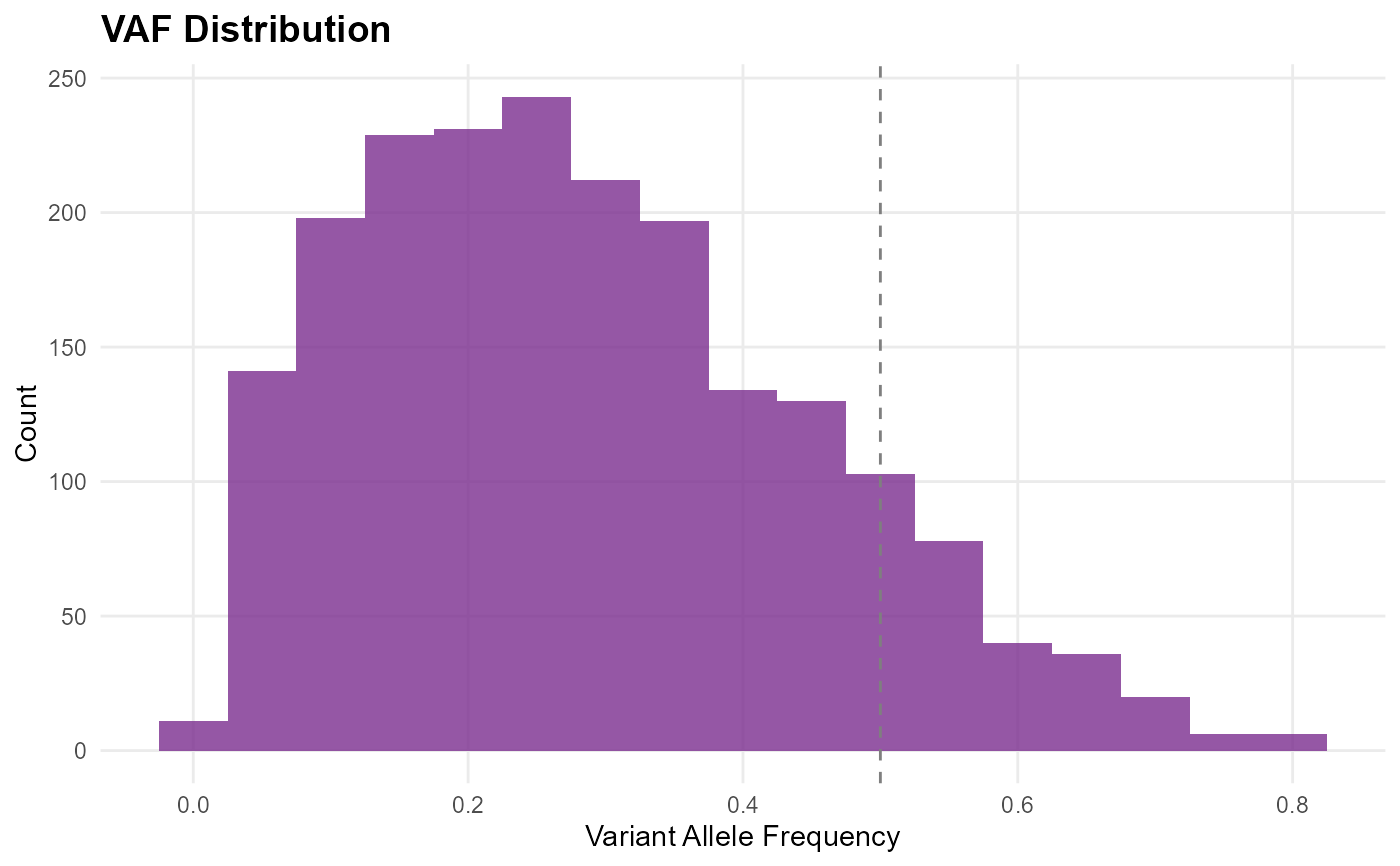
Histogram or density plot of variant allele frequencies (VAF), optionally filtered by gene.
Value
A ggplot2::ggplot object.
Examples
# \donttest{
db <- mp_example_db(n_patients = 20, seed = 1)
mp_plot_vaf_distribution(db)

mp_plot_vaf_distribution(db, gene = "TP53")

# }
# }